


Parameters, Page Navigation & Auto Refresh
Last week we laid out our Classic Models sales dashboard using a Tile Layer, arranging three charts - Revenue by Product Line, Monthly Sales Trend, and Top Customers by Order Value - into a clean, evenly-distributed row. This week we'll make that dashboard interactive and self-maintaining with three more Business Insight features: Parameters, Page Navigation, and Auto Refresh.
Making It Interactive with Parameters
A static "all-time" view is useful, but it's more valuable if a viewer can flip between years without anyone rebuilding the charts. That's what a Parameter is for; it's a reusable variable you define once at the workspace level, then apply as a filter across multiple charts at once.
- Click New Parameter in the main toolbar.
- Name it
OrderYear. - Verify that
Data Source (Custom Field) / Chart / Dashboardis selected for Use In and that Data Type is set toNumber. - Set its Allowed Values to List, and populate it with the three distinct years found in
orders.orderDate: 2003, 2004, and 2005.
Note that the Current Value is set to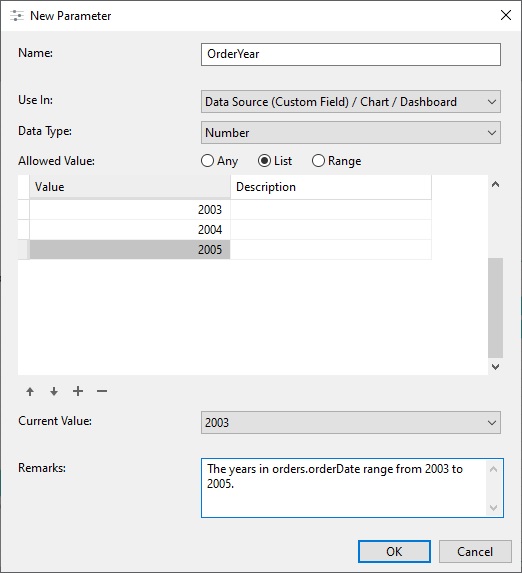
2003. That means that when we apply theOrderYearto a chart, it will filter on that value. - Click OK to create the new parameter.
Applying a Parameter to a Chart
In order to filter the results in a chart to the current value of the OrderYear parameter (2003), we need to open the chart in the designer and apply OrderYear as a Data Filter on the relevant date field.
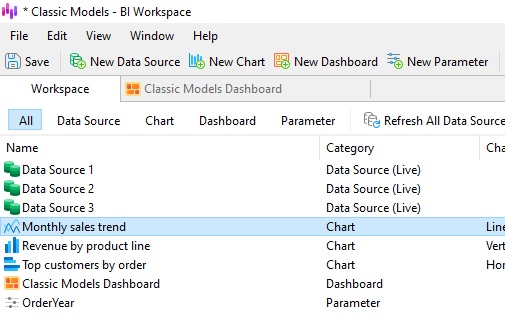
- Locate the chart that you want to apply the parameter to in the Workspace and double click it. That will open the Chart Designer in a new tab.
- Click the Data Filter button, followed by the [+] button to add filter criteria. By default, the
orderMonthfield is selected.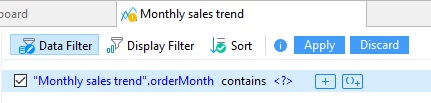
- Click the word contains and select begins with from the context menu (dates are formatted yyyy-mm).
- Click the <?>. That opens a dialog where we can choose a value (or values) to filter by. To designate the parameter that we created earlier, check the Show Parameters Only box, followed by [$OrderYear]:
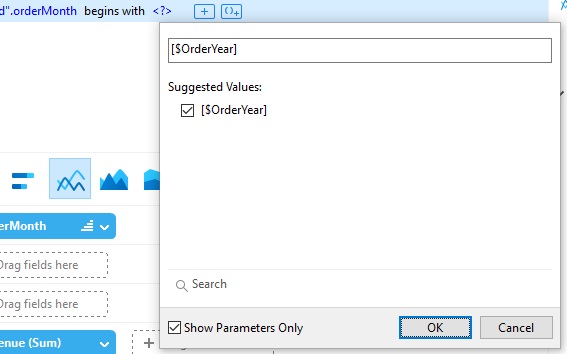
- Now, clicking Apply shows sales for 2003 only.
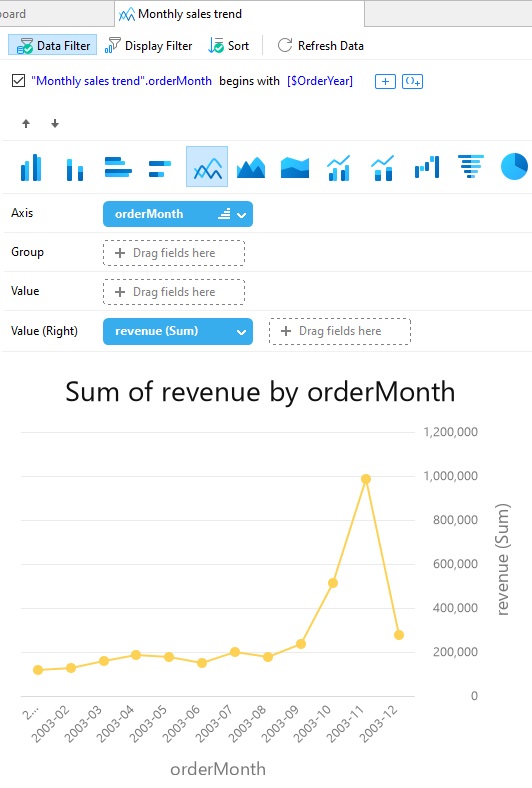
Once applied, the chart will updated whenever someone changes the selected year from the dashboard - no need to touch the underlying query at all!
Connecting Pages with Page Navigation
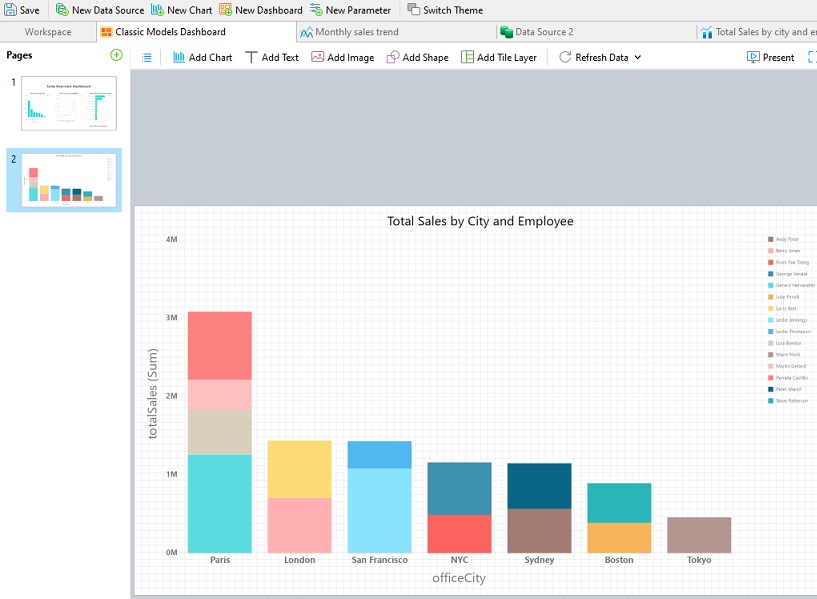
Our dashboard could easily grow a second page if we were to add, say, a breakdown of sales by office and employee. Page Navigation lets you link the two together directly, rather than leaving viewers to hunt for the right tab.
Here is the Classic Models Dashboard with the office/employee breakdown chart added to a second page:
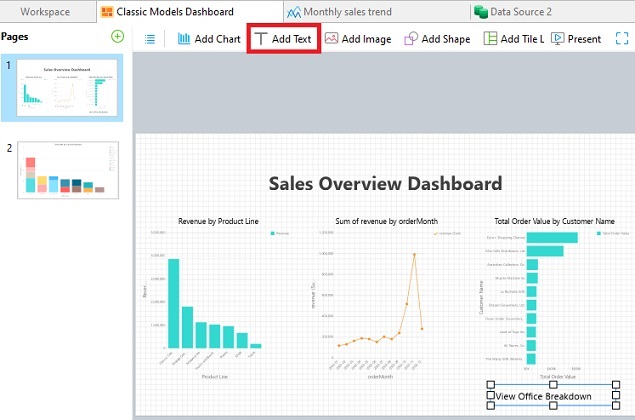
- Back on the main Sales Overview Dashboard page, add a text label reading something like "View Office Breakdown".
- Select the label, and in its properties pane, set Page Navigation to point to the new page.
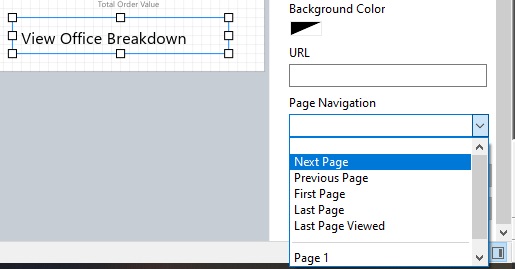
Now, in Present mode, clicking the label now jumps the viewer straight to the office breakdown page, turning a set of separate dashboard pages into something that behaves more like a small application than a stack of slides.
Keeping It Current with Auto Refresh
If this dashboard ends up on a shared screen or gets checked regularly, stale numbers defeat the purpose of building it in the first place. That's where Auto Refresh comes in.
- Click the down arrow next to Refresh Data in the toolbar.
- Choose an automatic refresh interval from the timing menu — every 15 minutes, for instance.
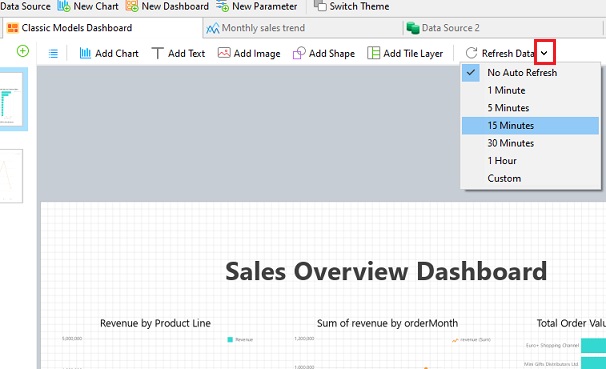
From that point on, Navicat pulls updated figures from classicmodels on according to the defined schedule, so nobody needs to remember to click Refresh before a meeting.
Putting It All Together
Combined with last week's Tile Layer, these three features round out a dashboard that adapts as it grows, lets viewers explore a year at a time without any rebuilding, links related views together, and keeps its numbers current without manual intervention. That's the difference between a handful of charts on a page and an actual reporting tool that you can rely on.