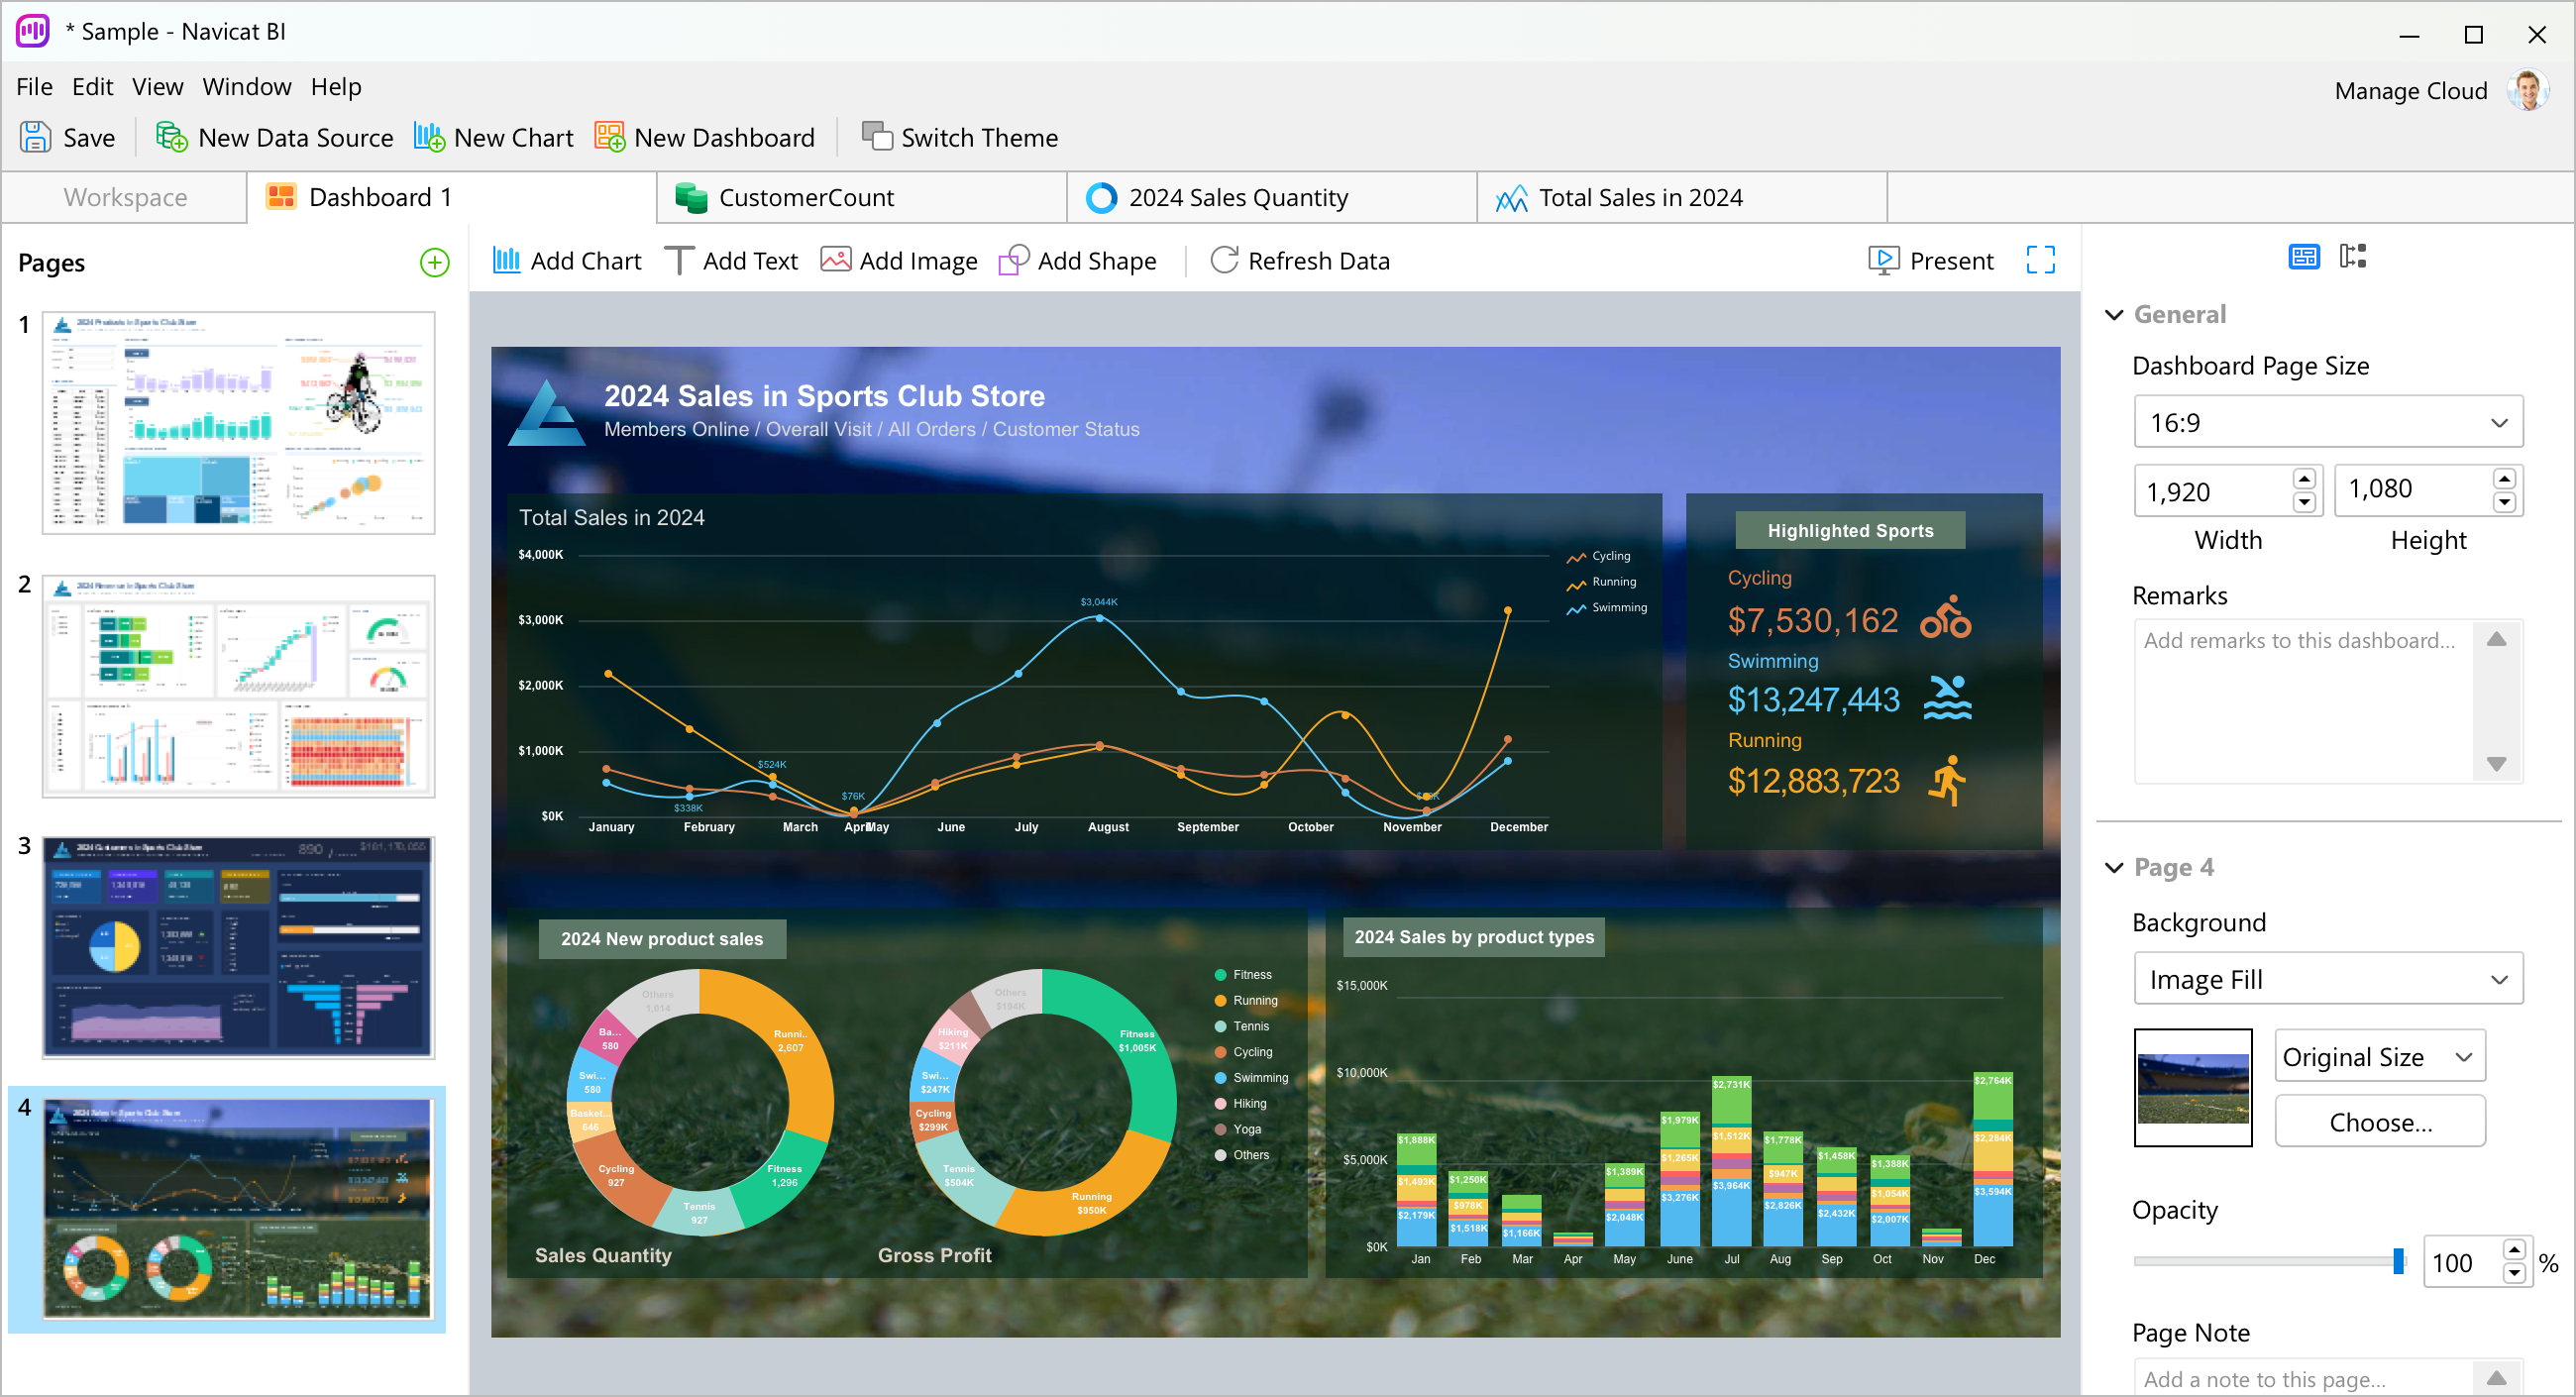
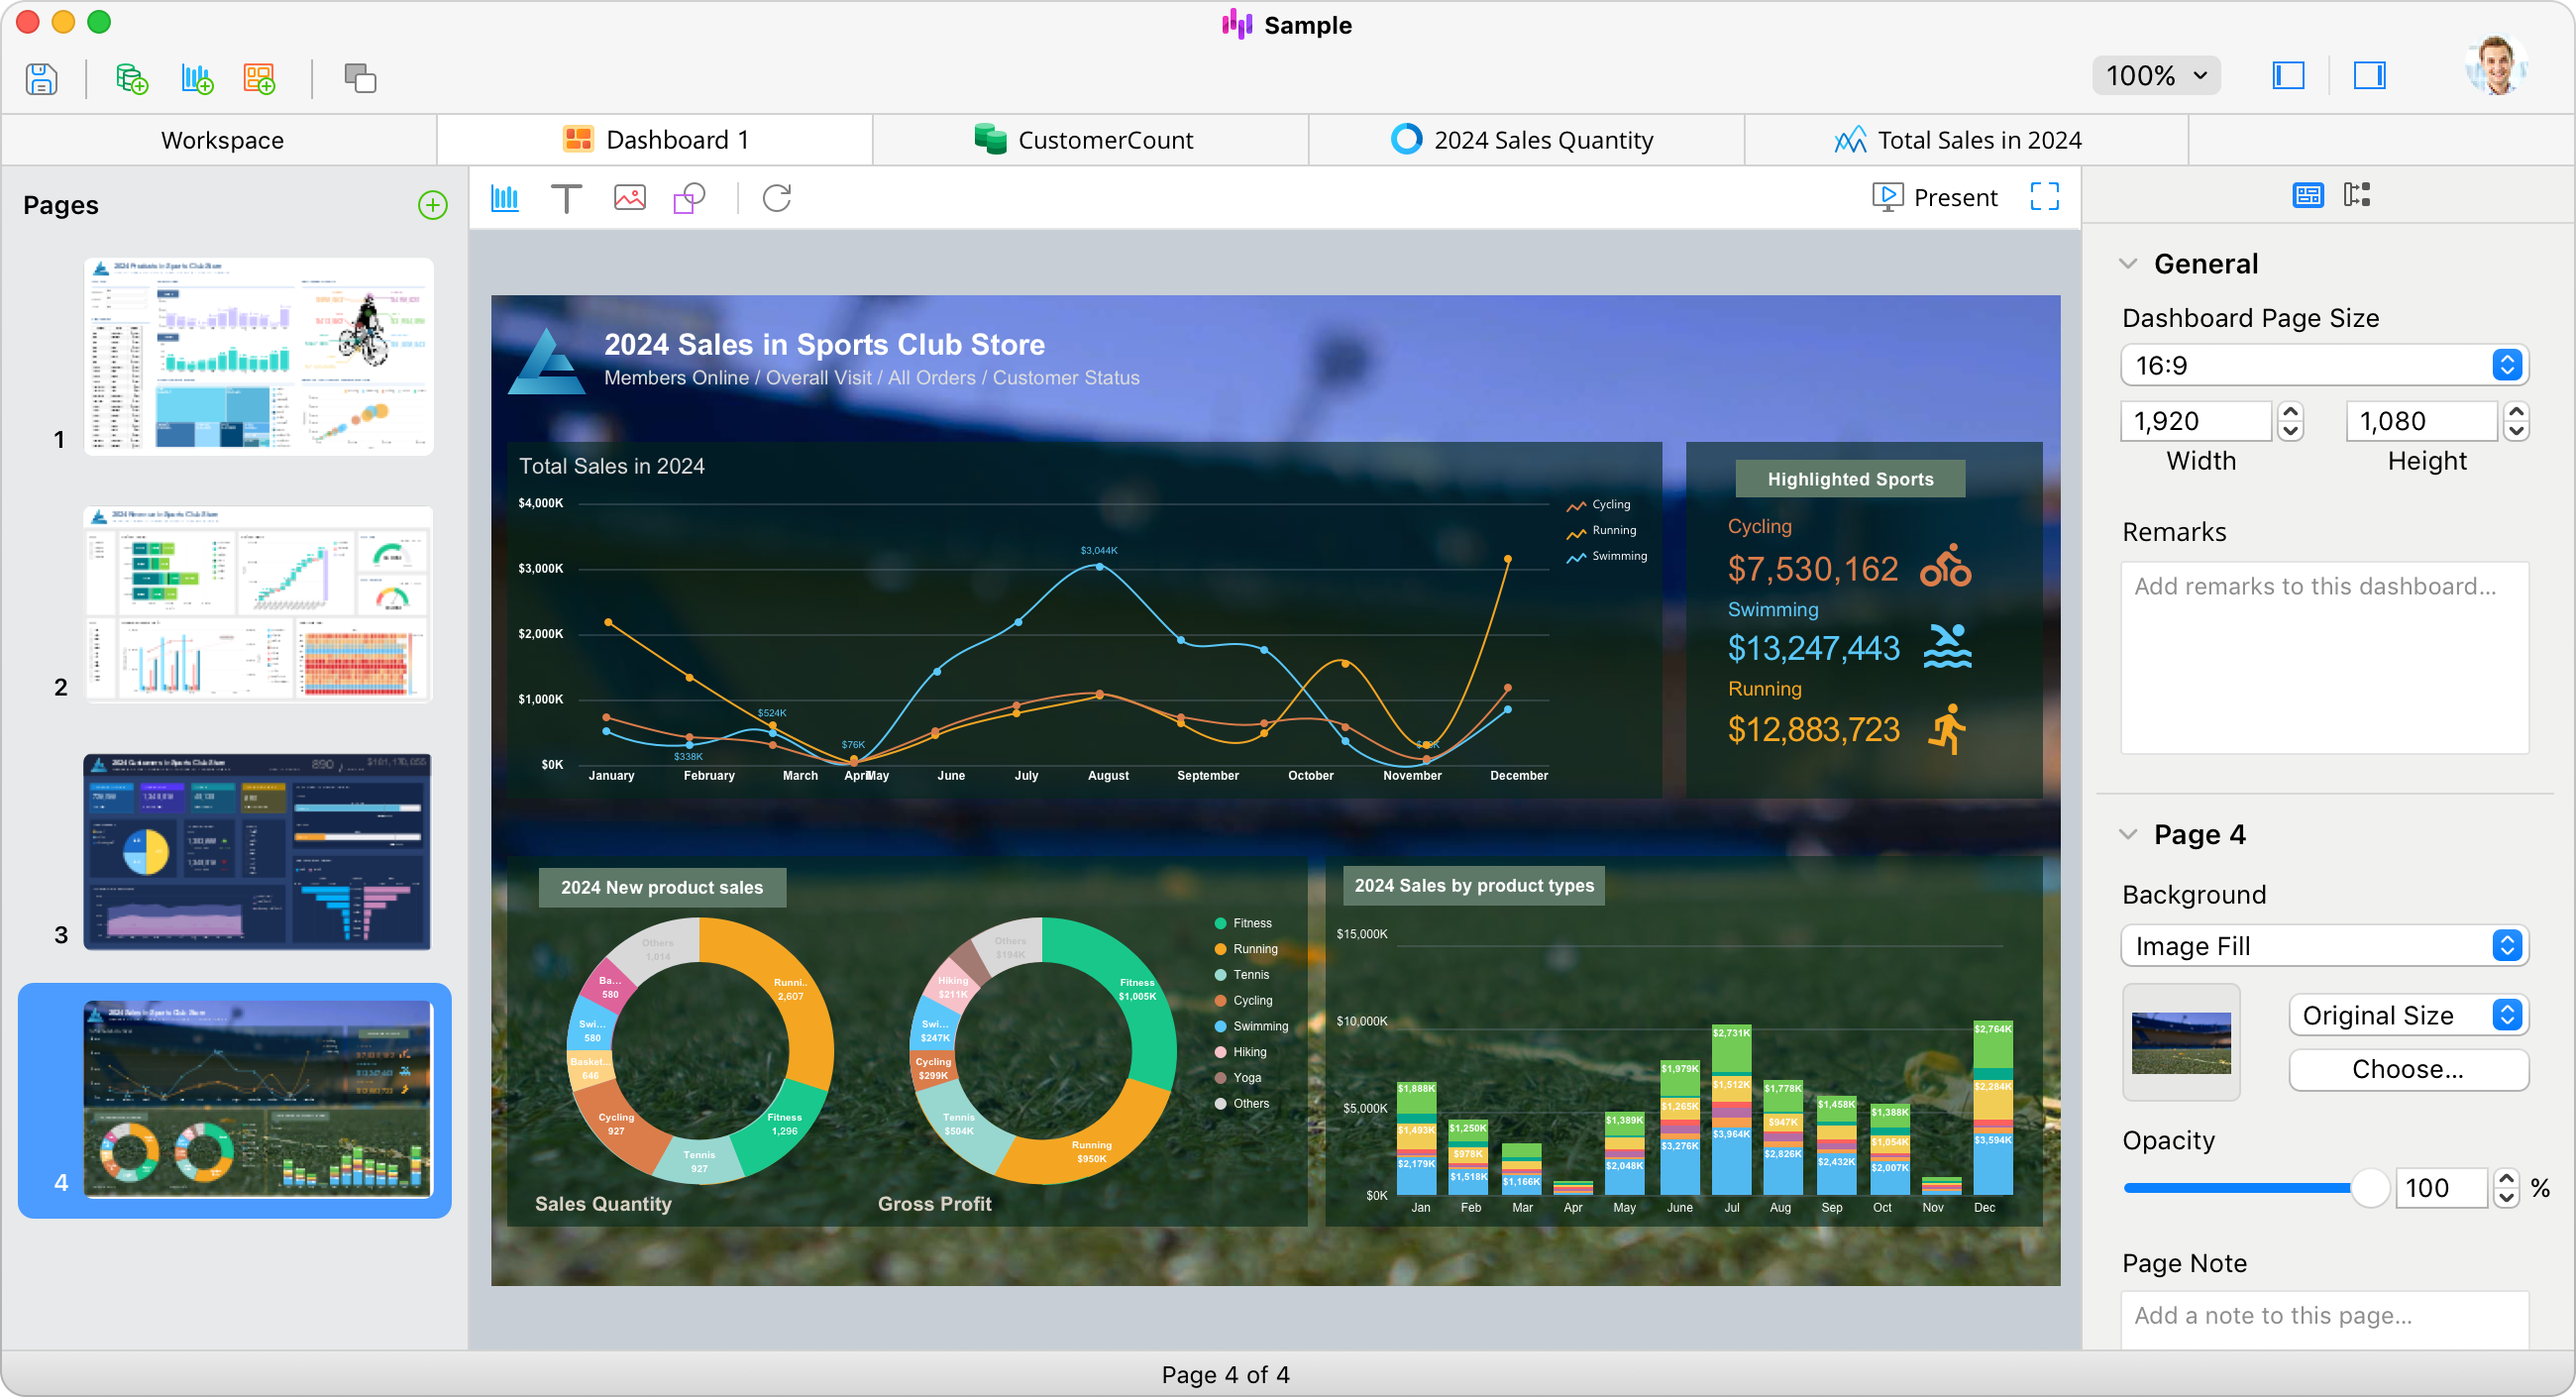
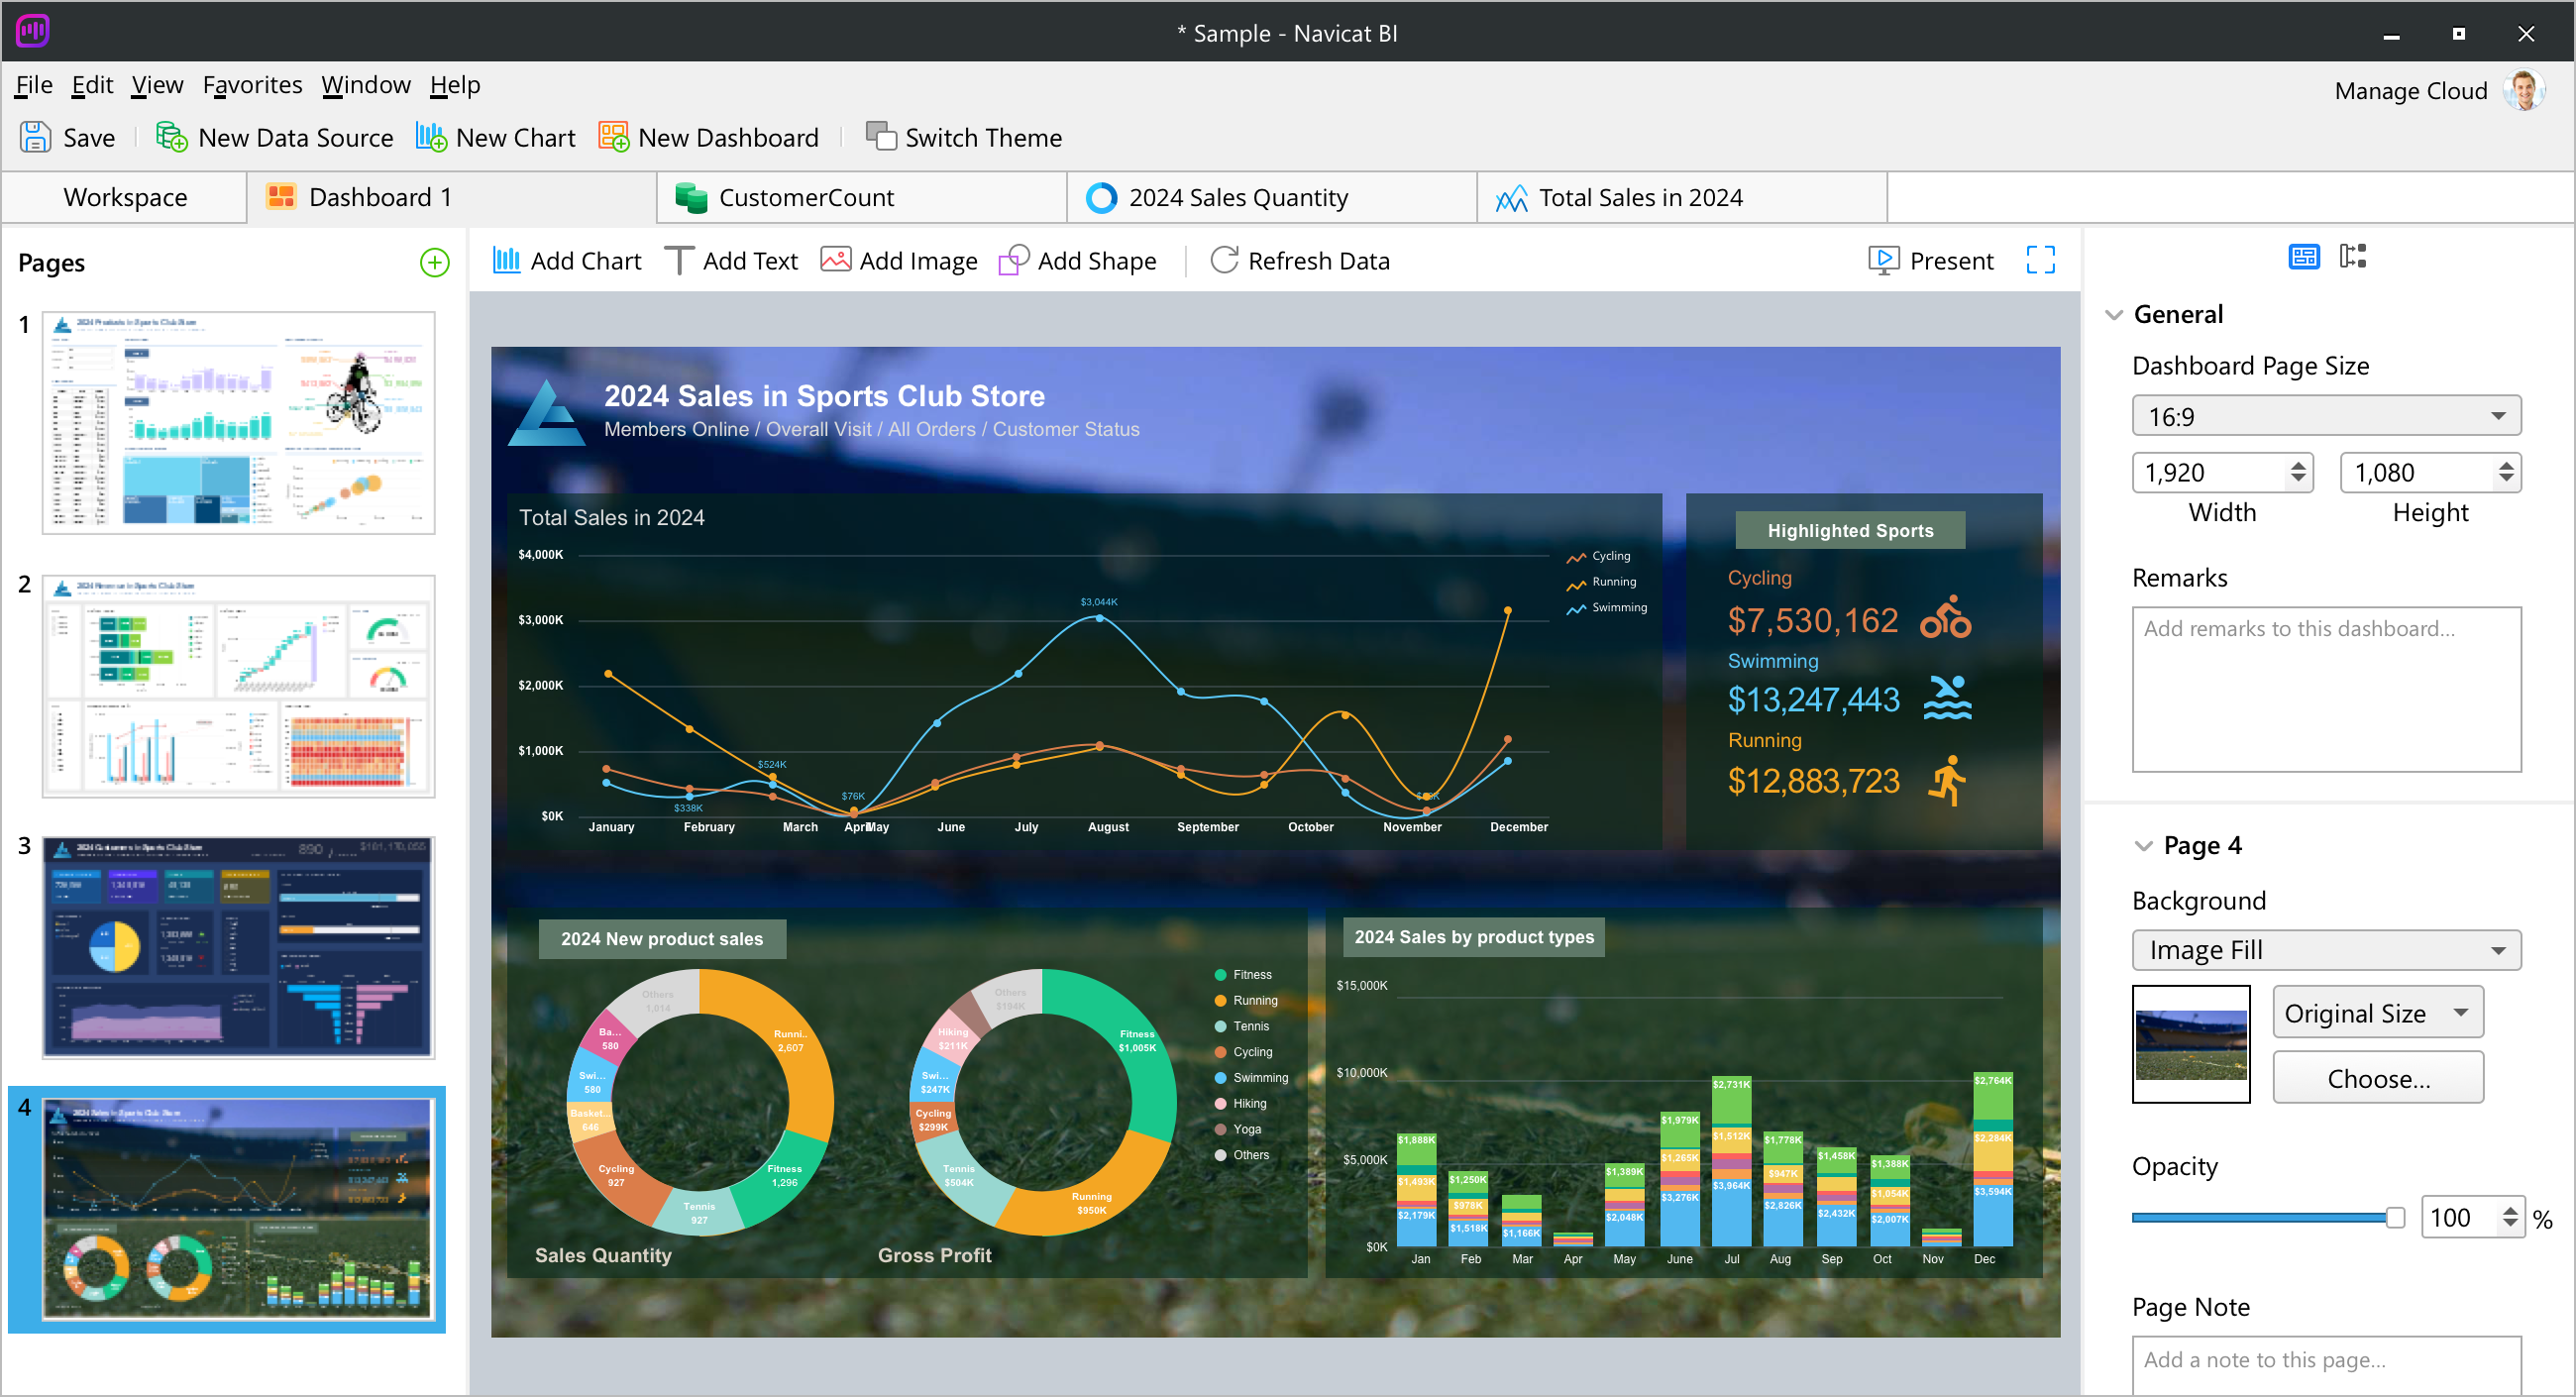
Unlock the Power of Data.
Empowering Decision-Making with Visual Intelligence.
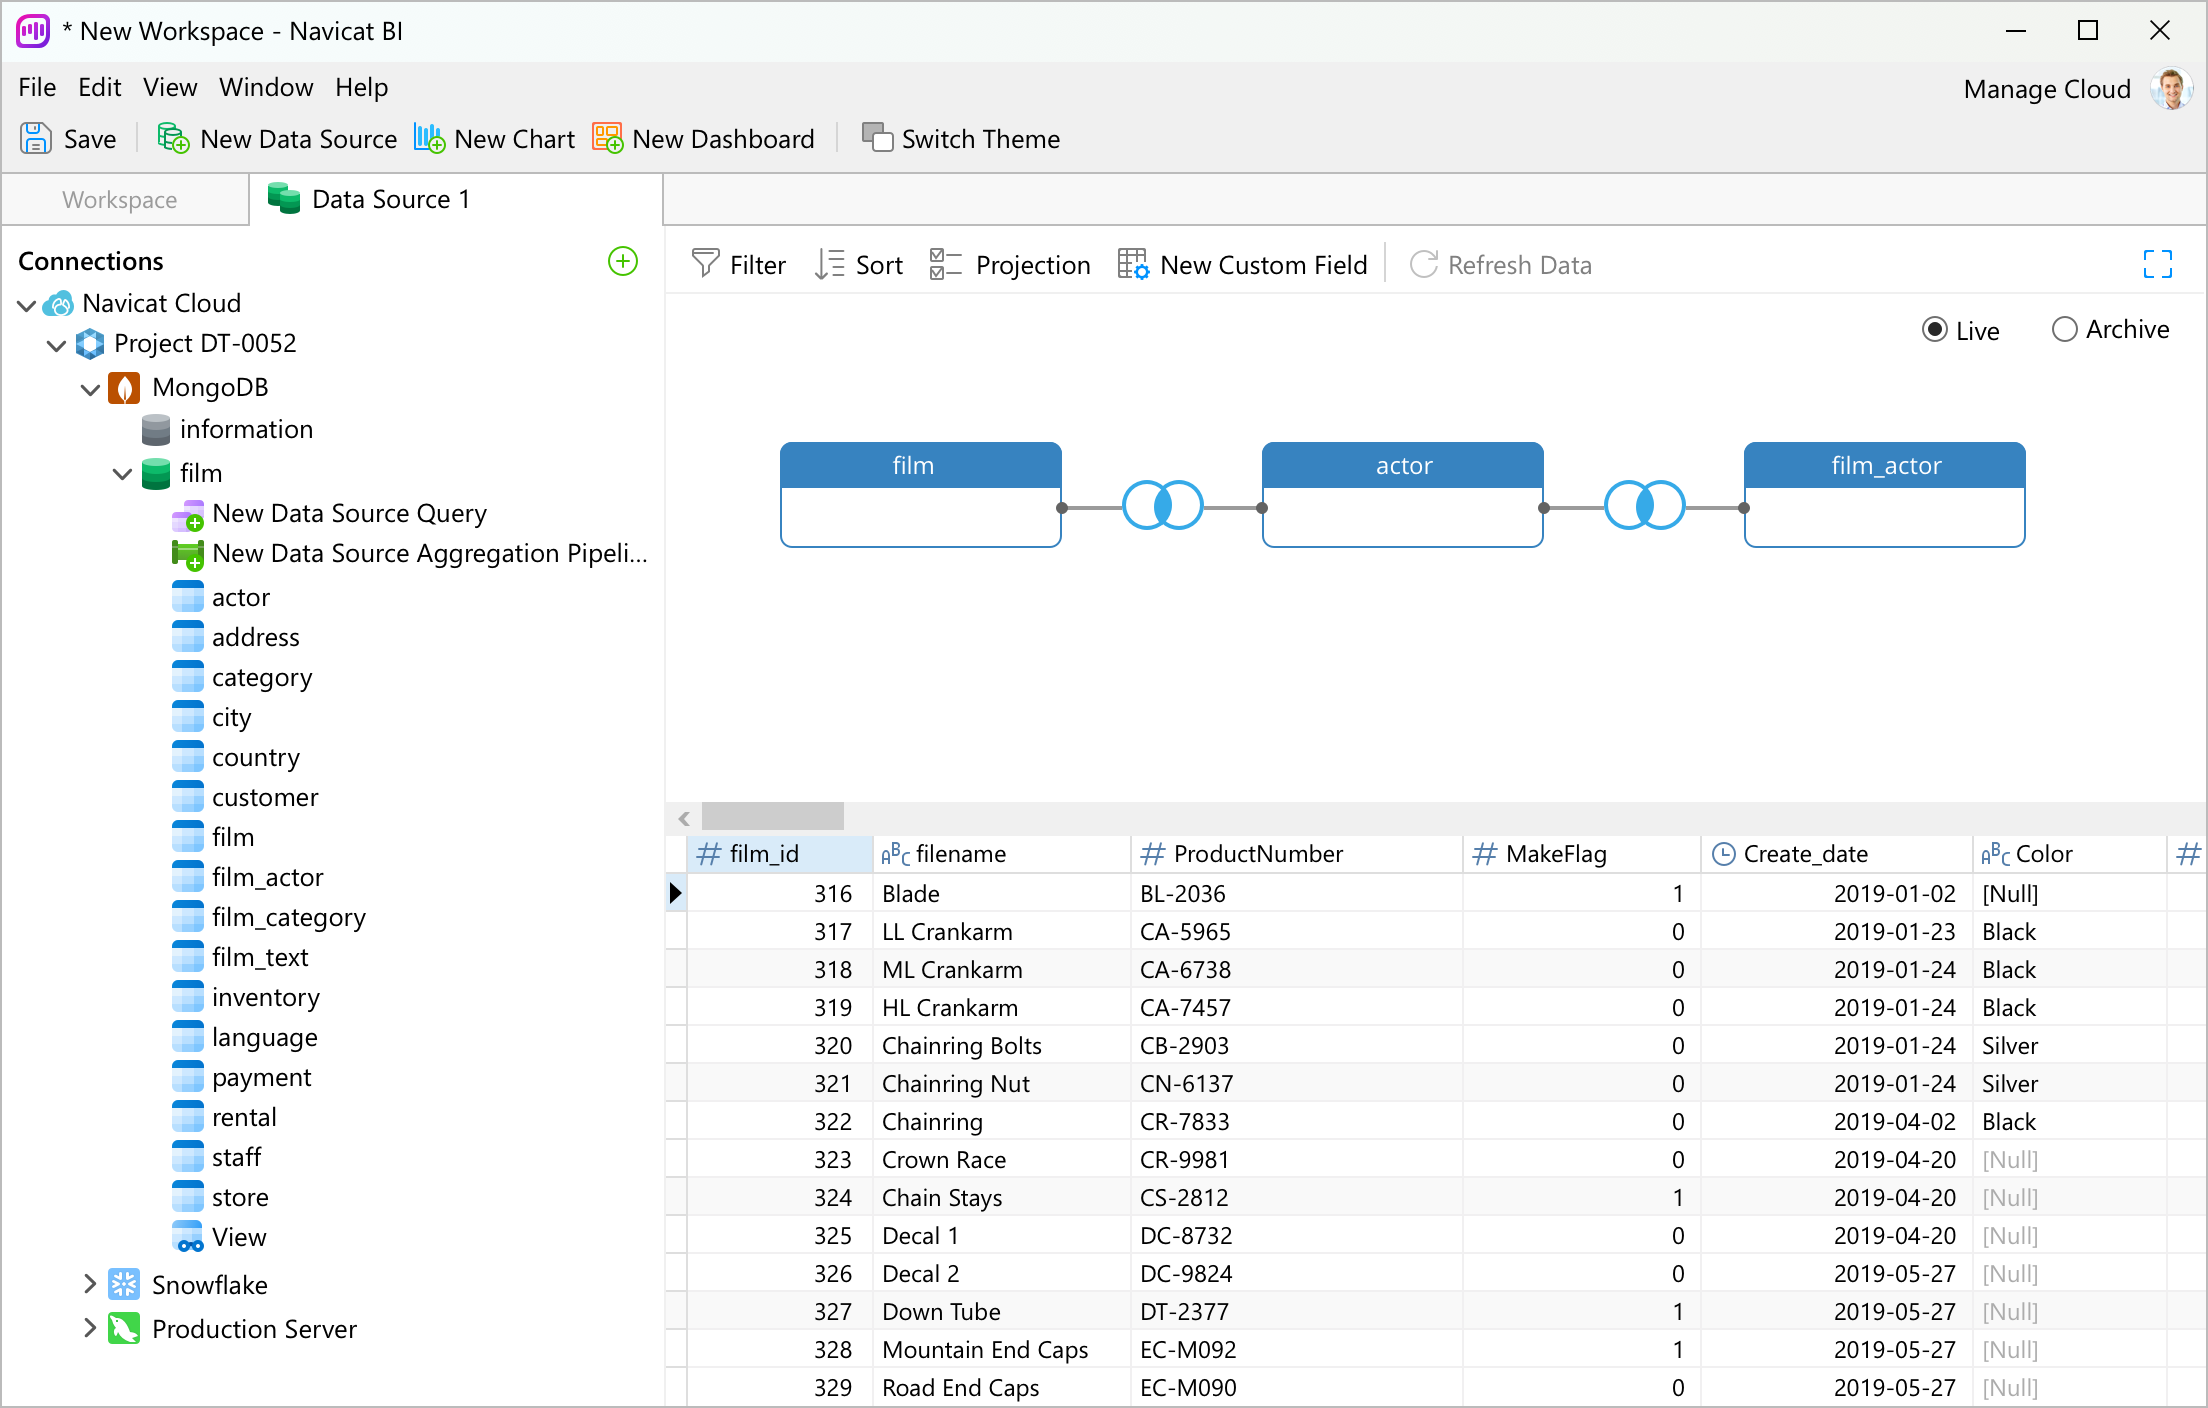
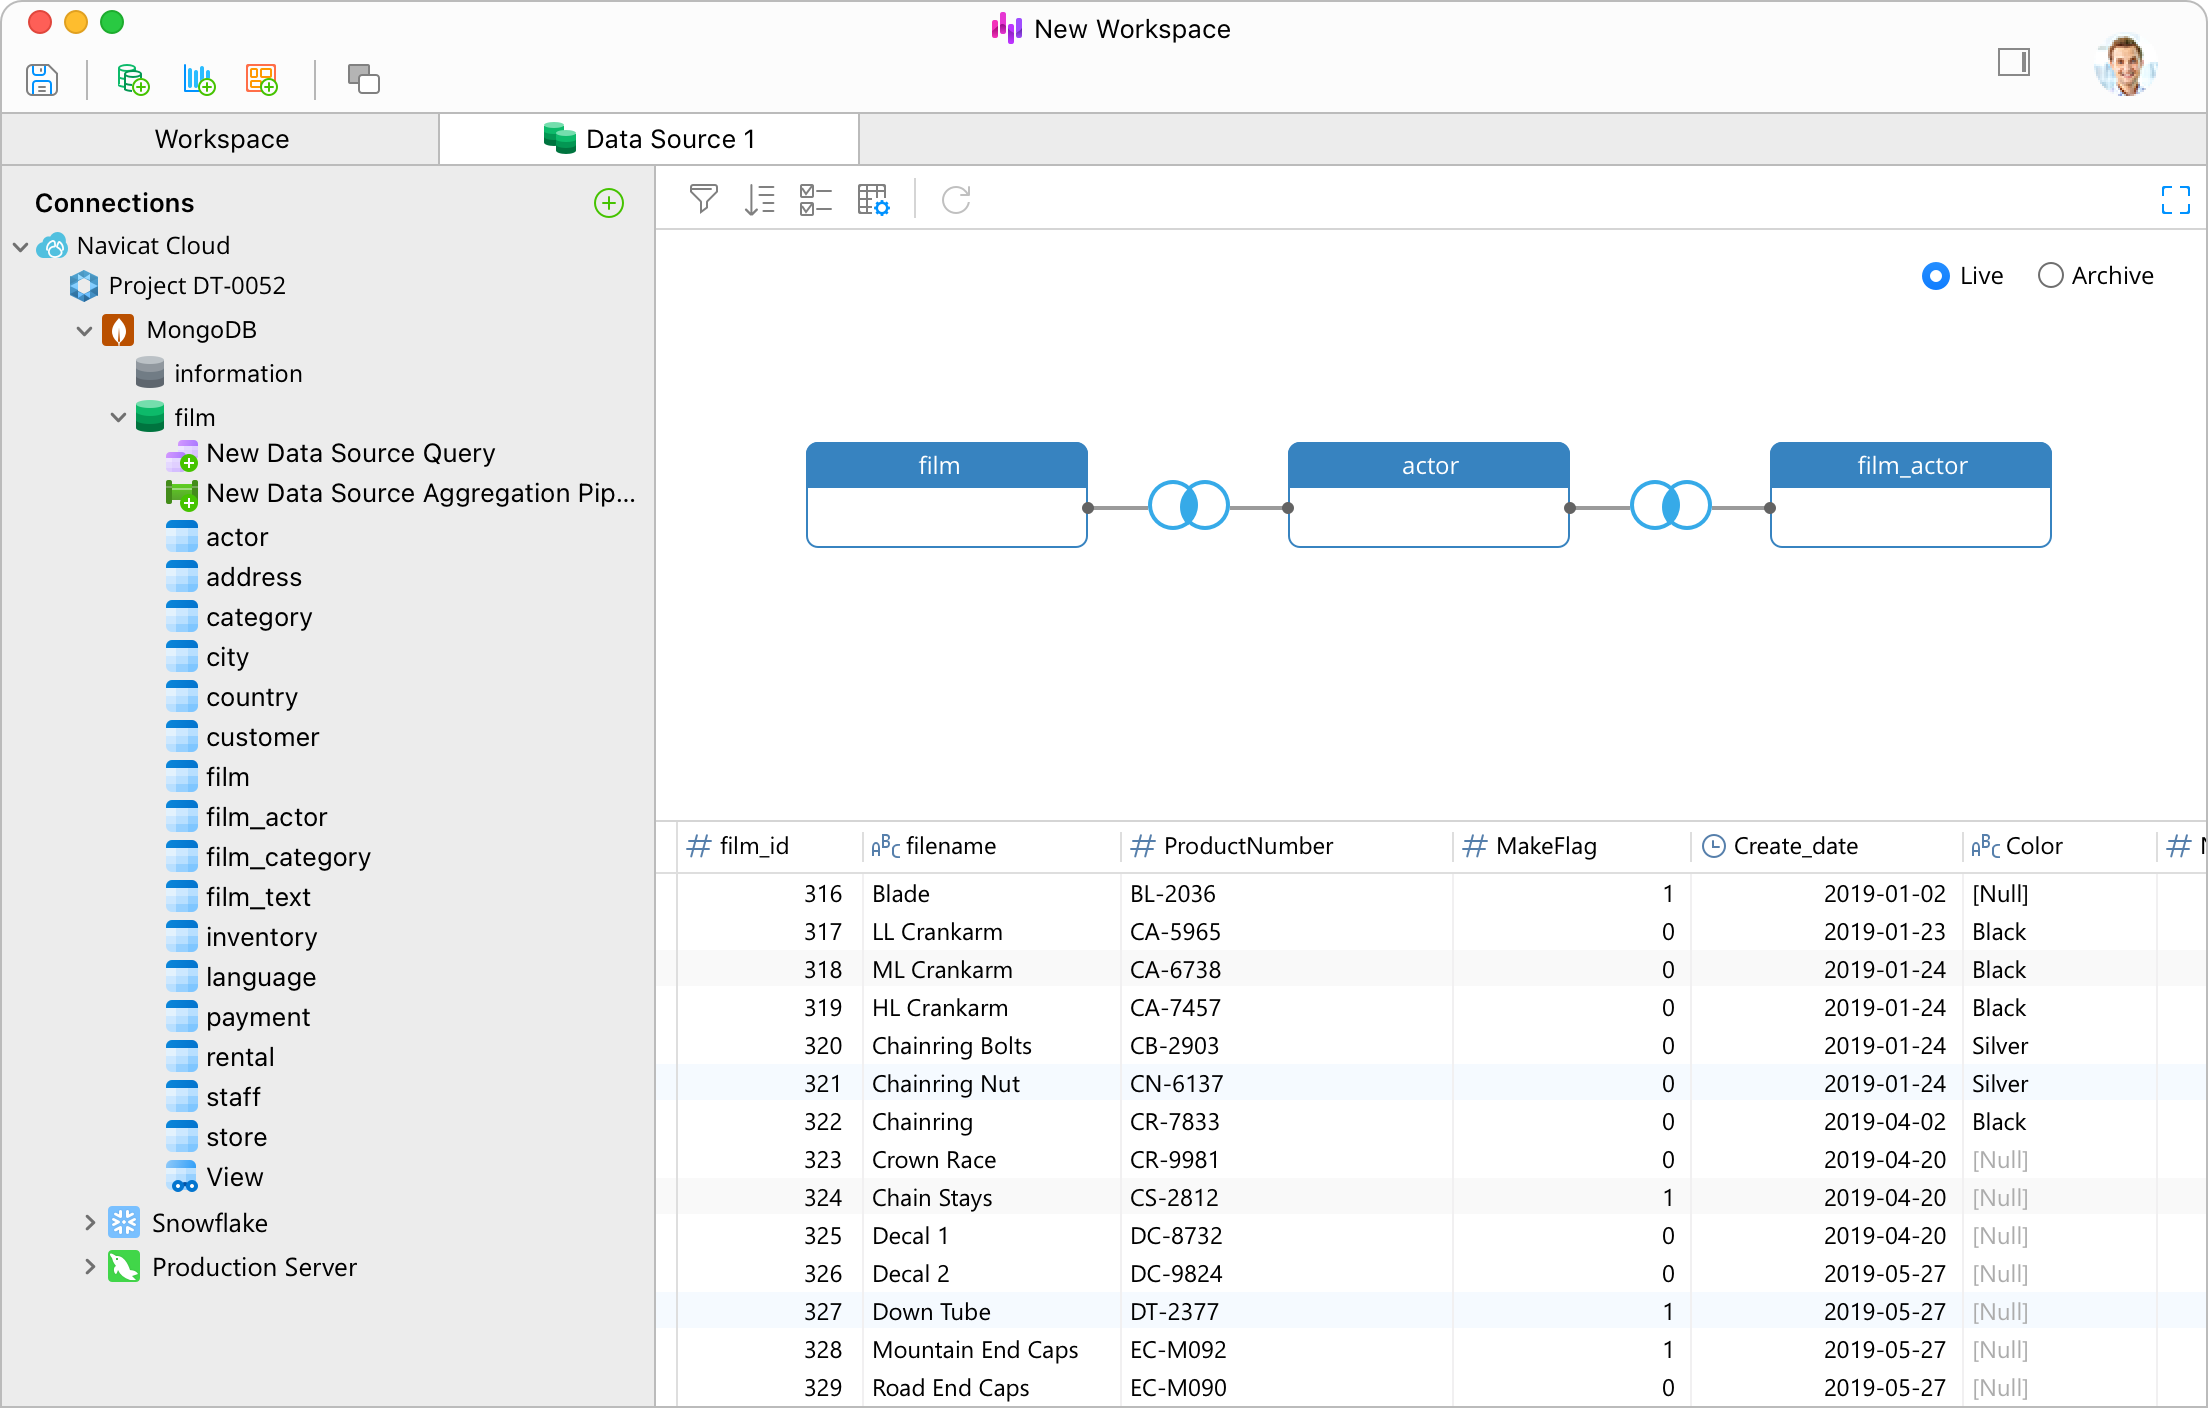
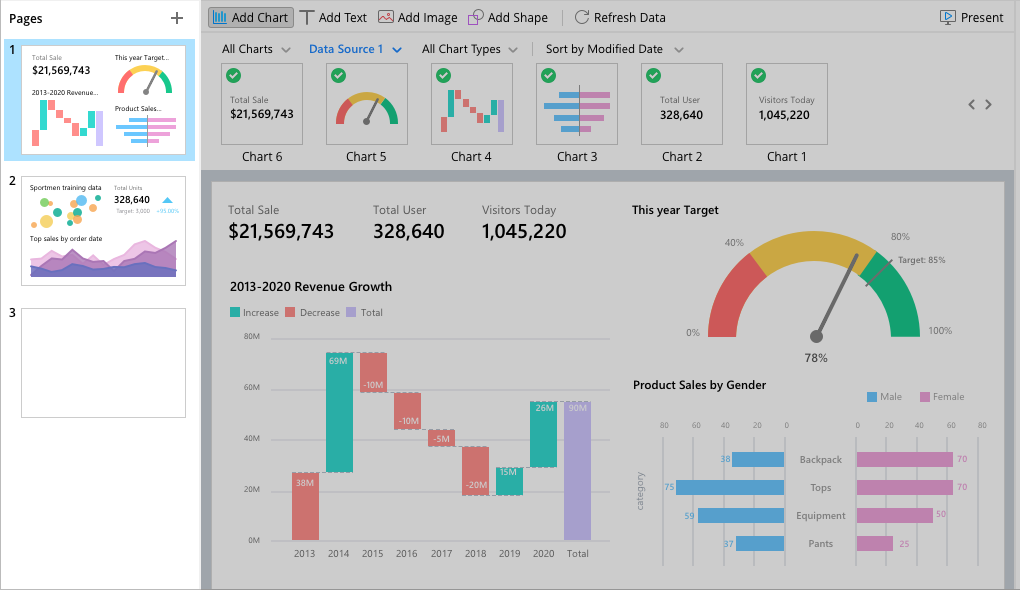
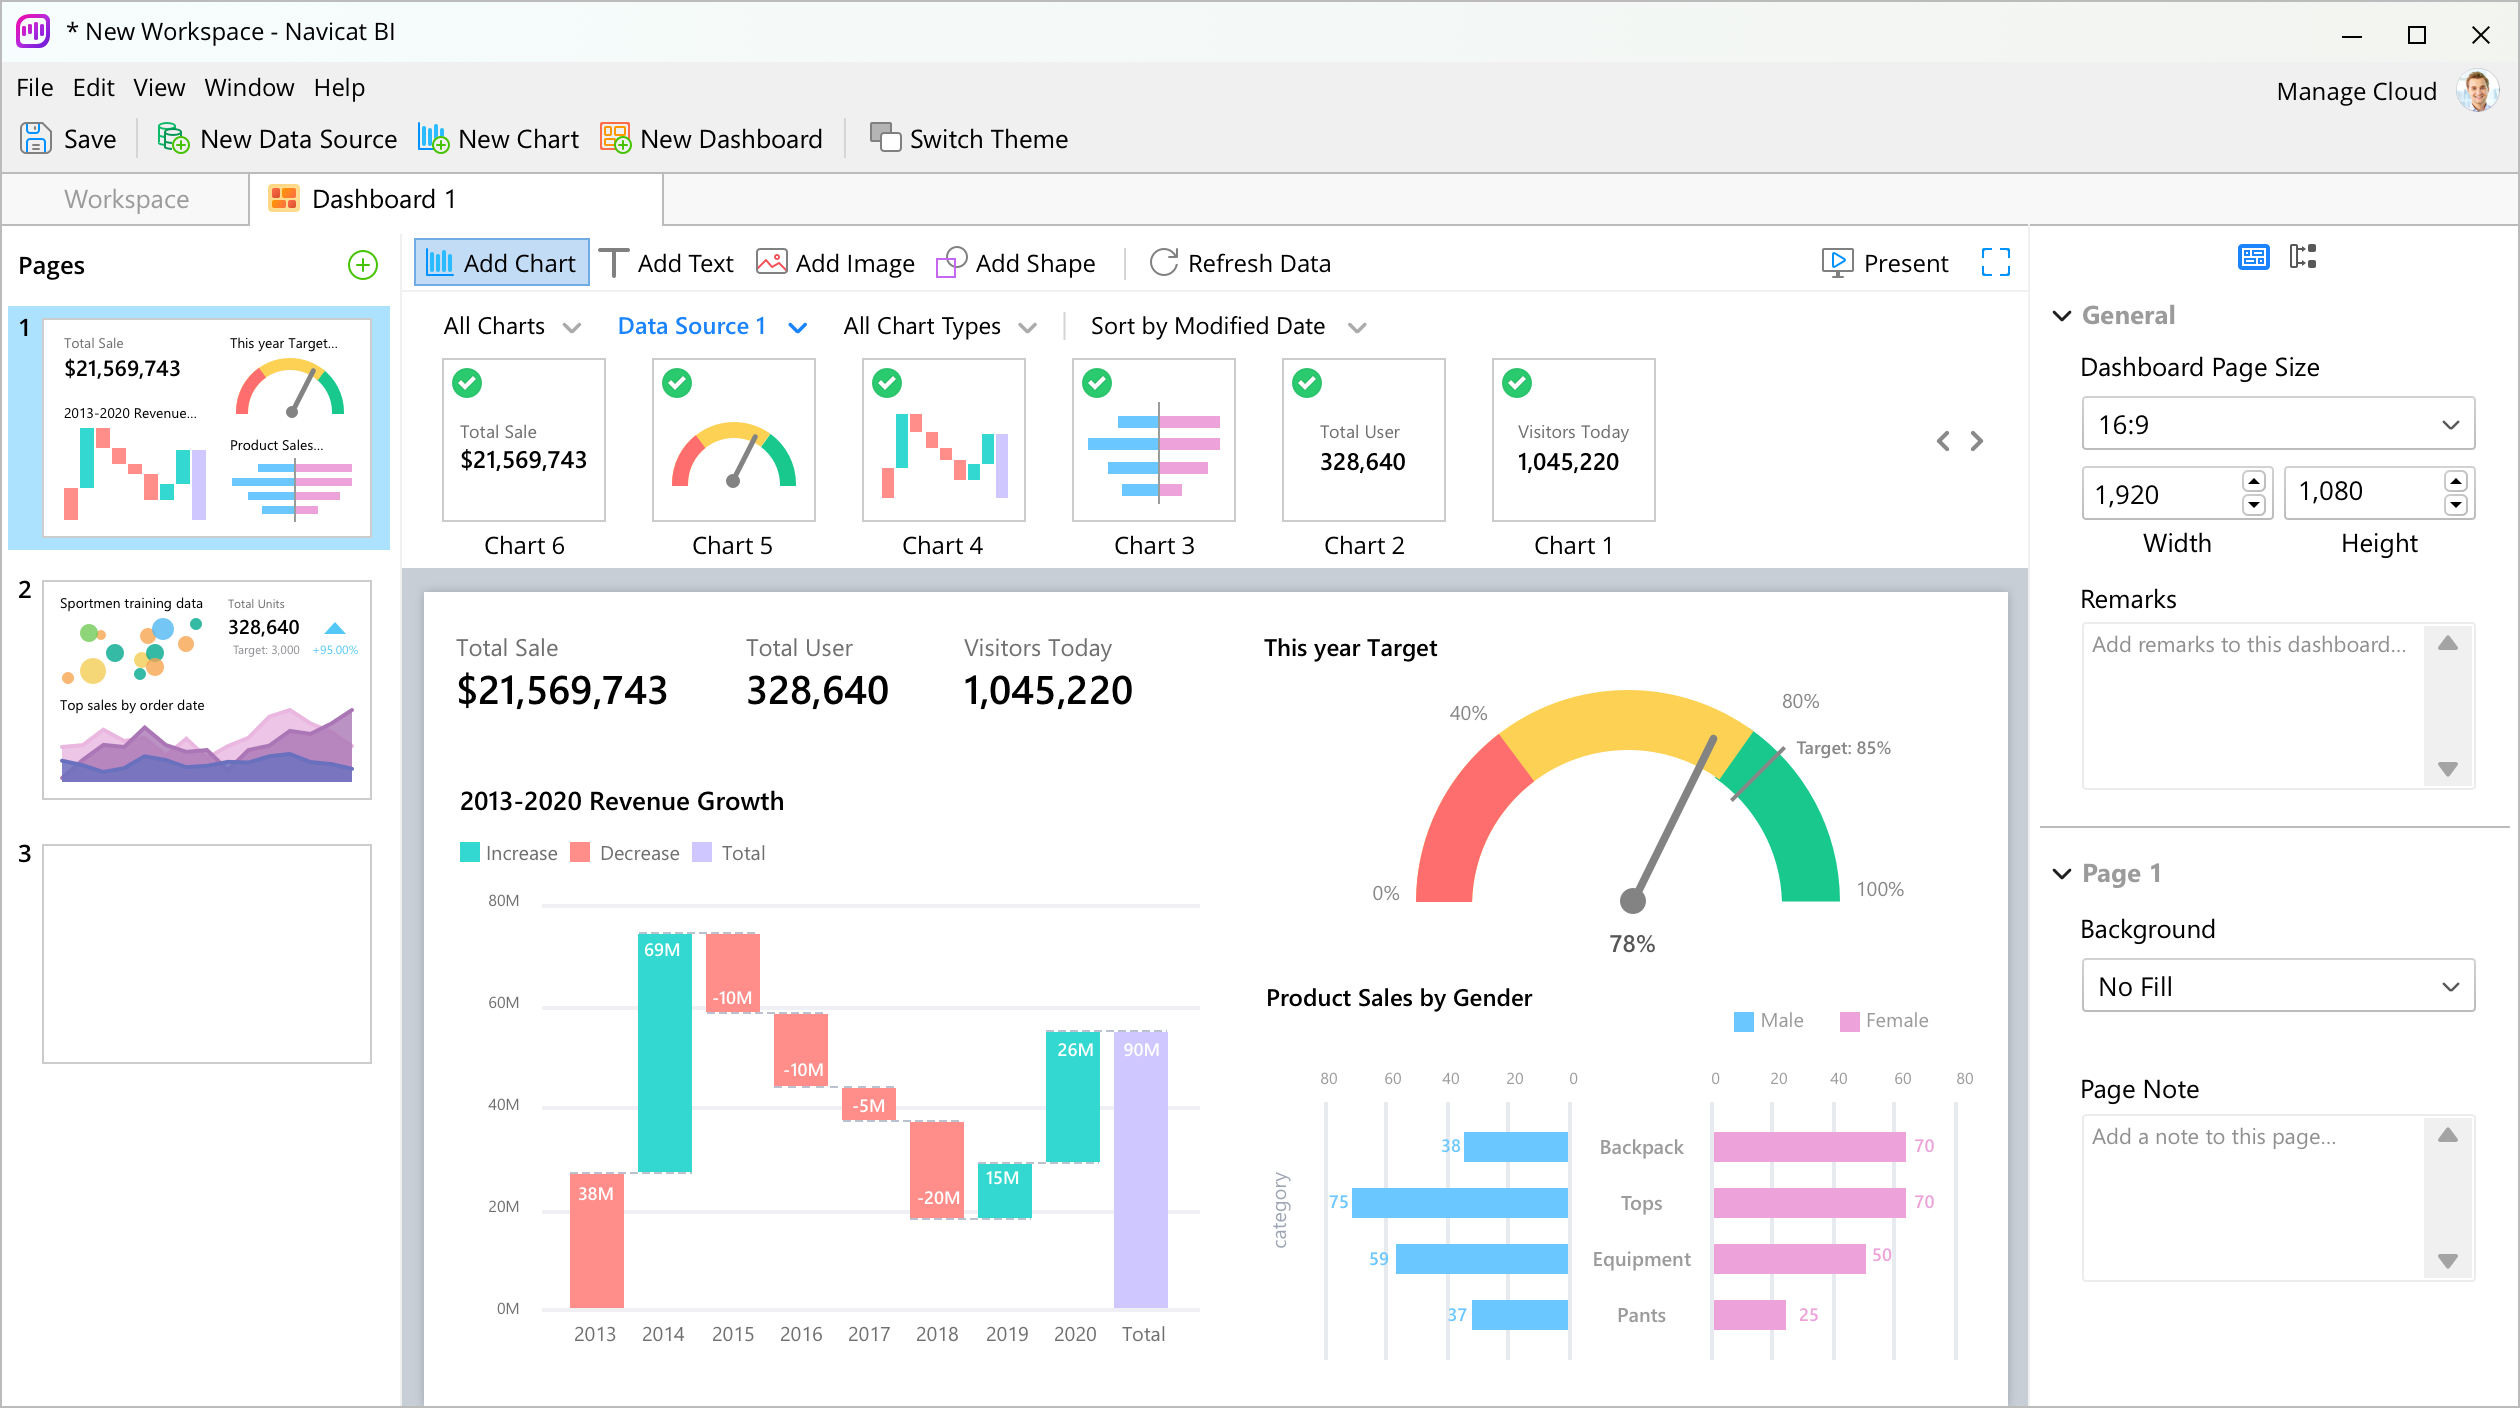
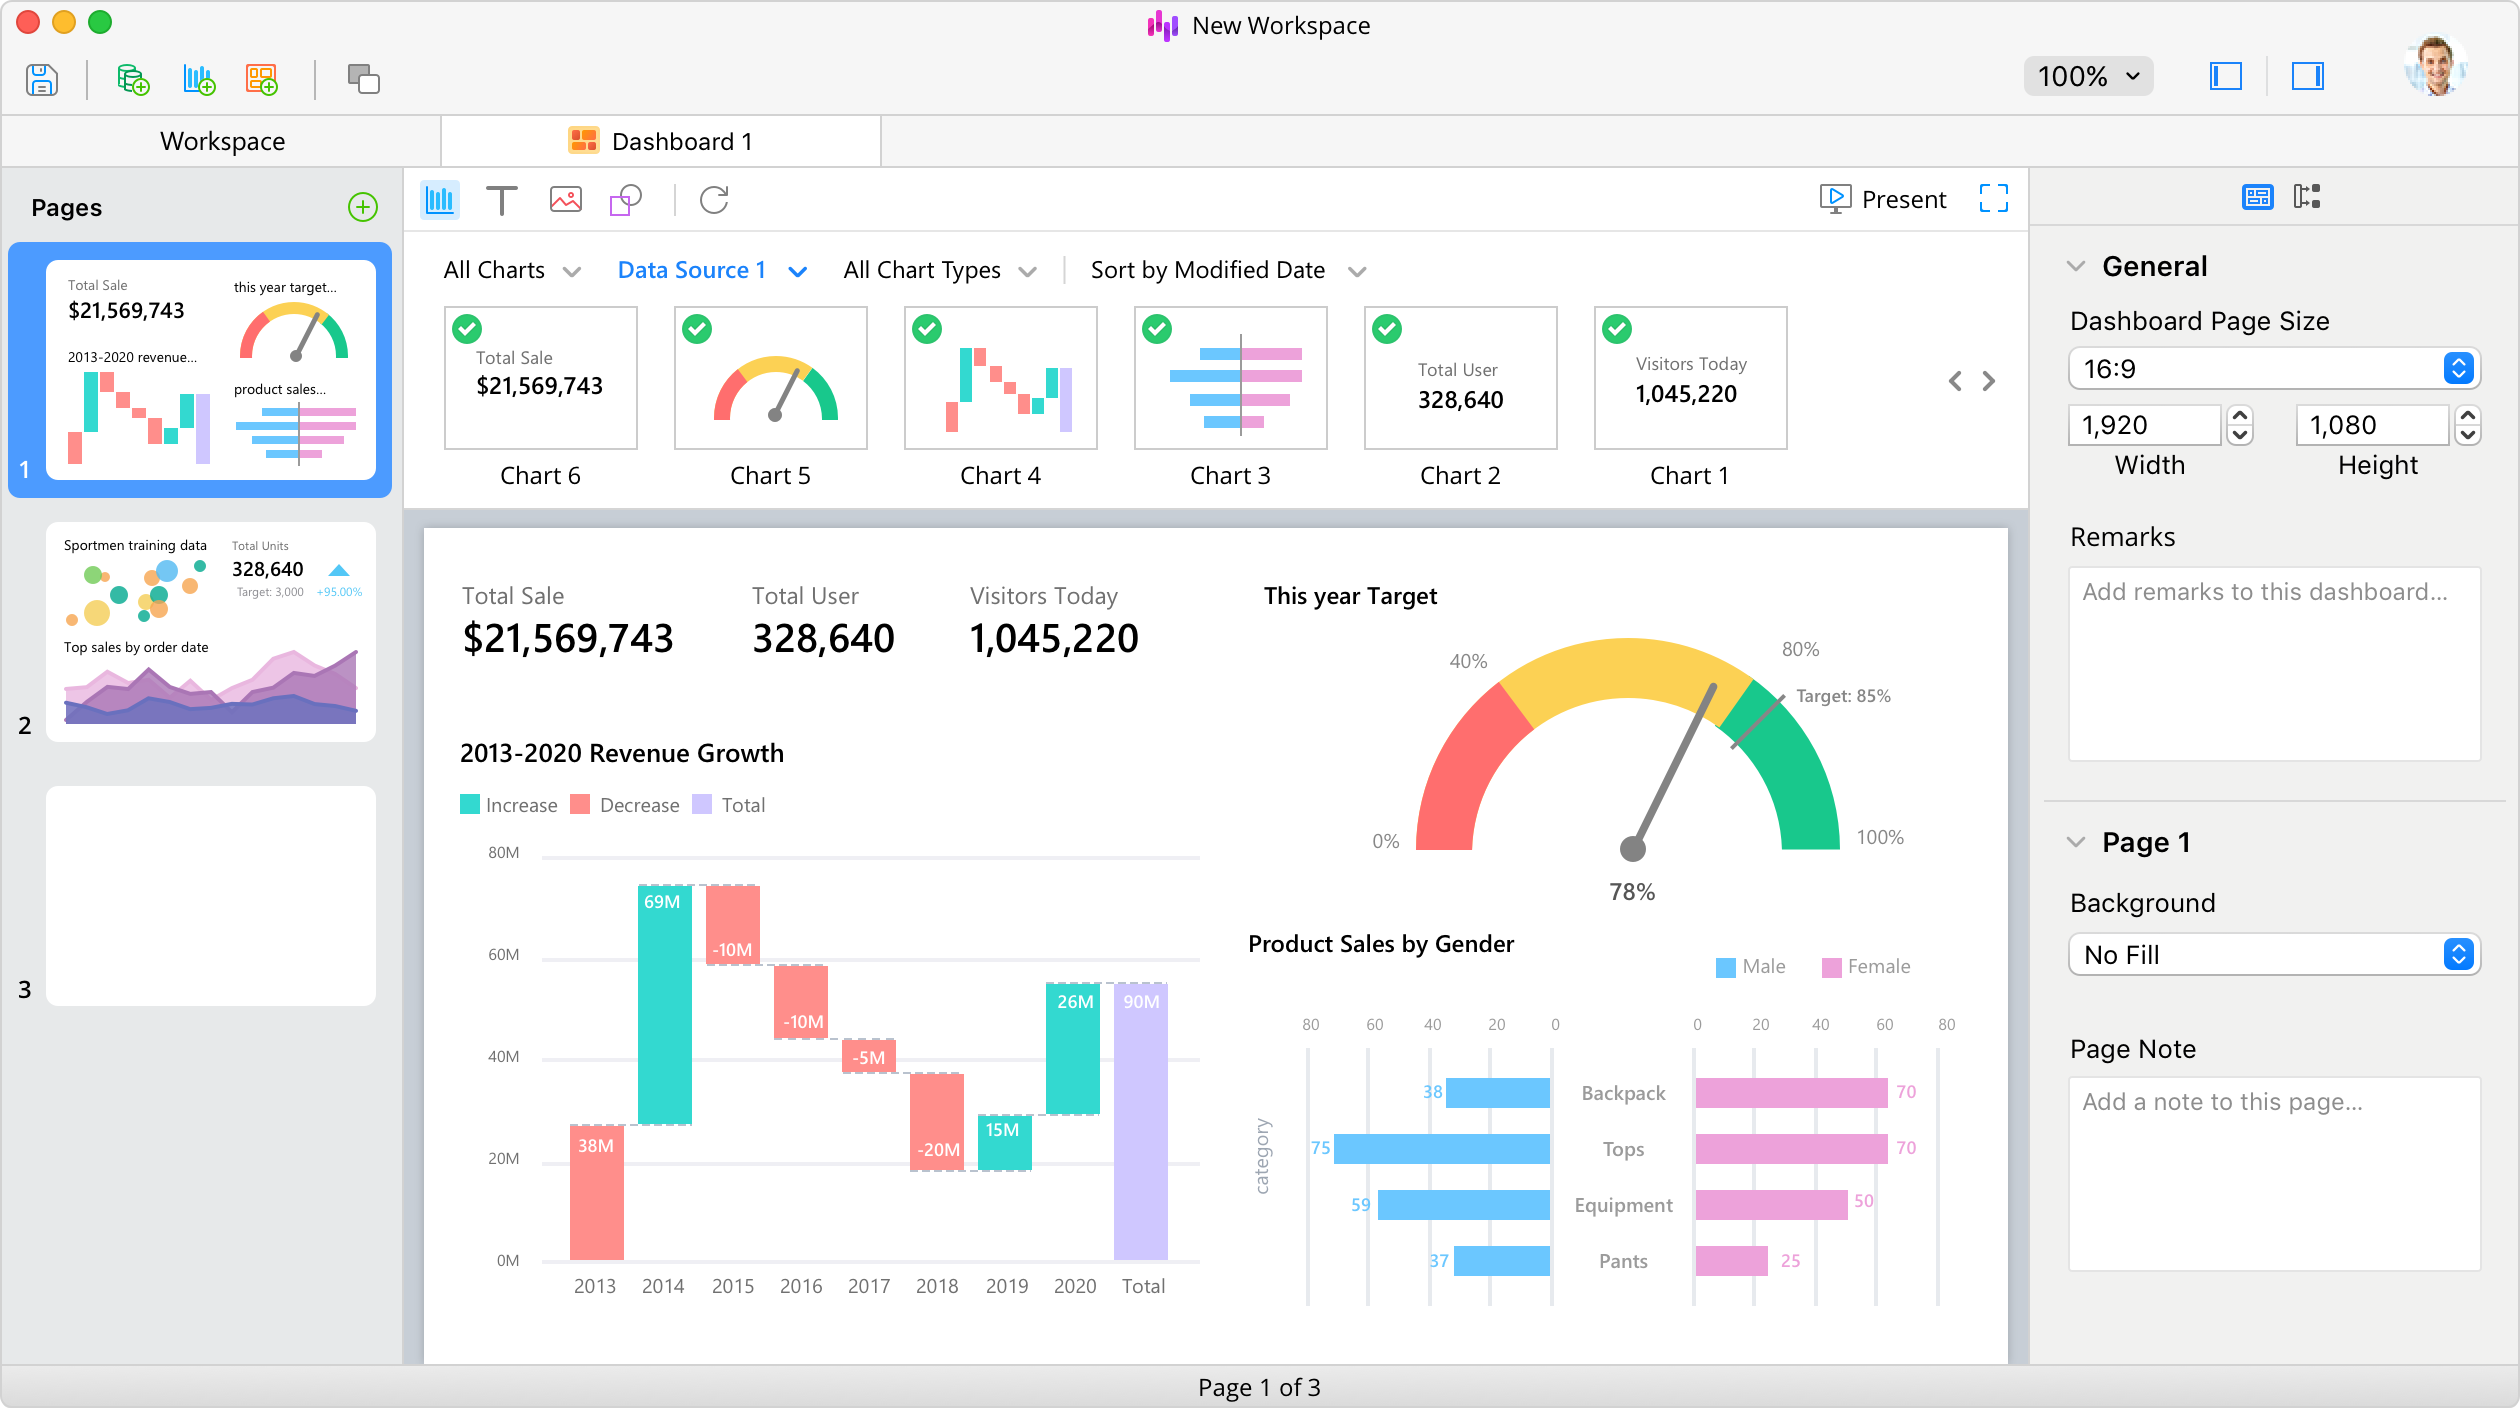
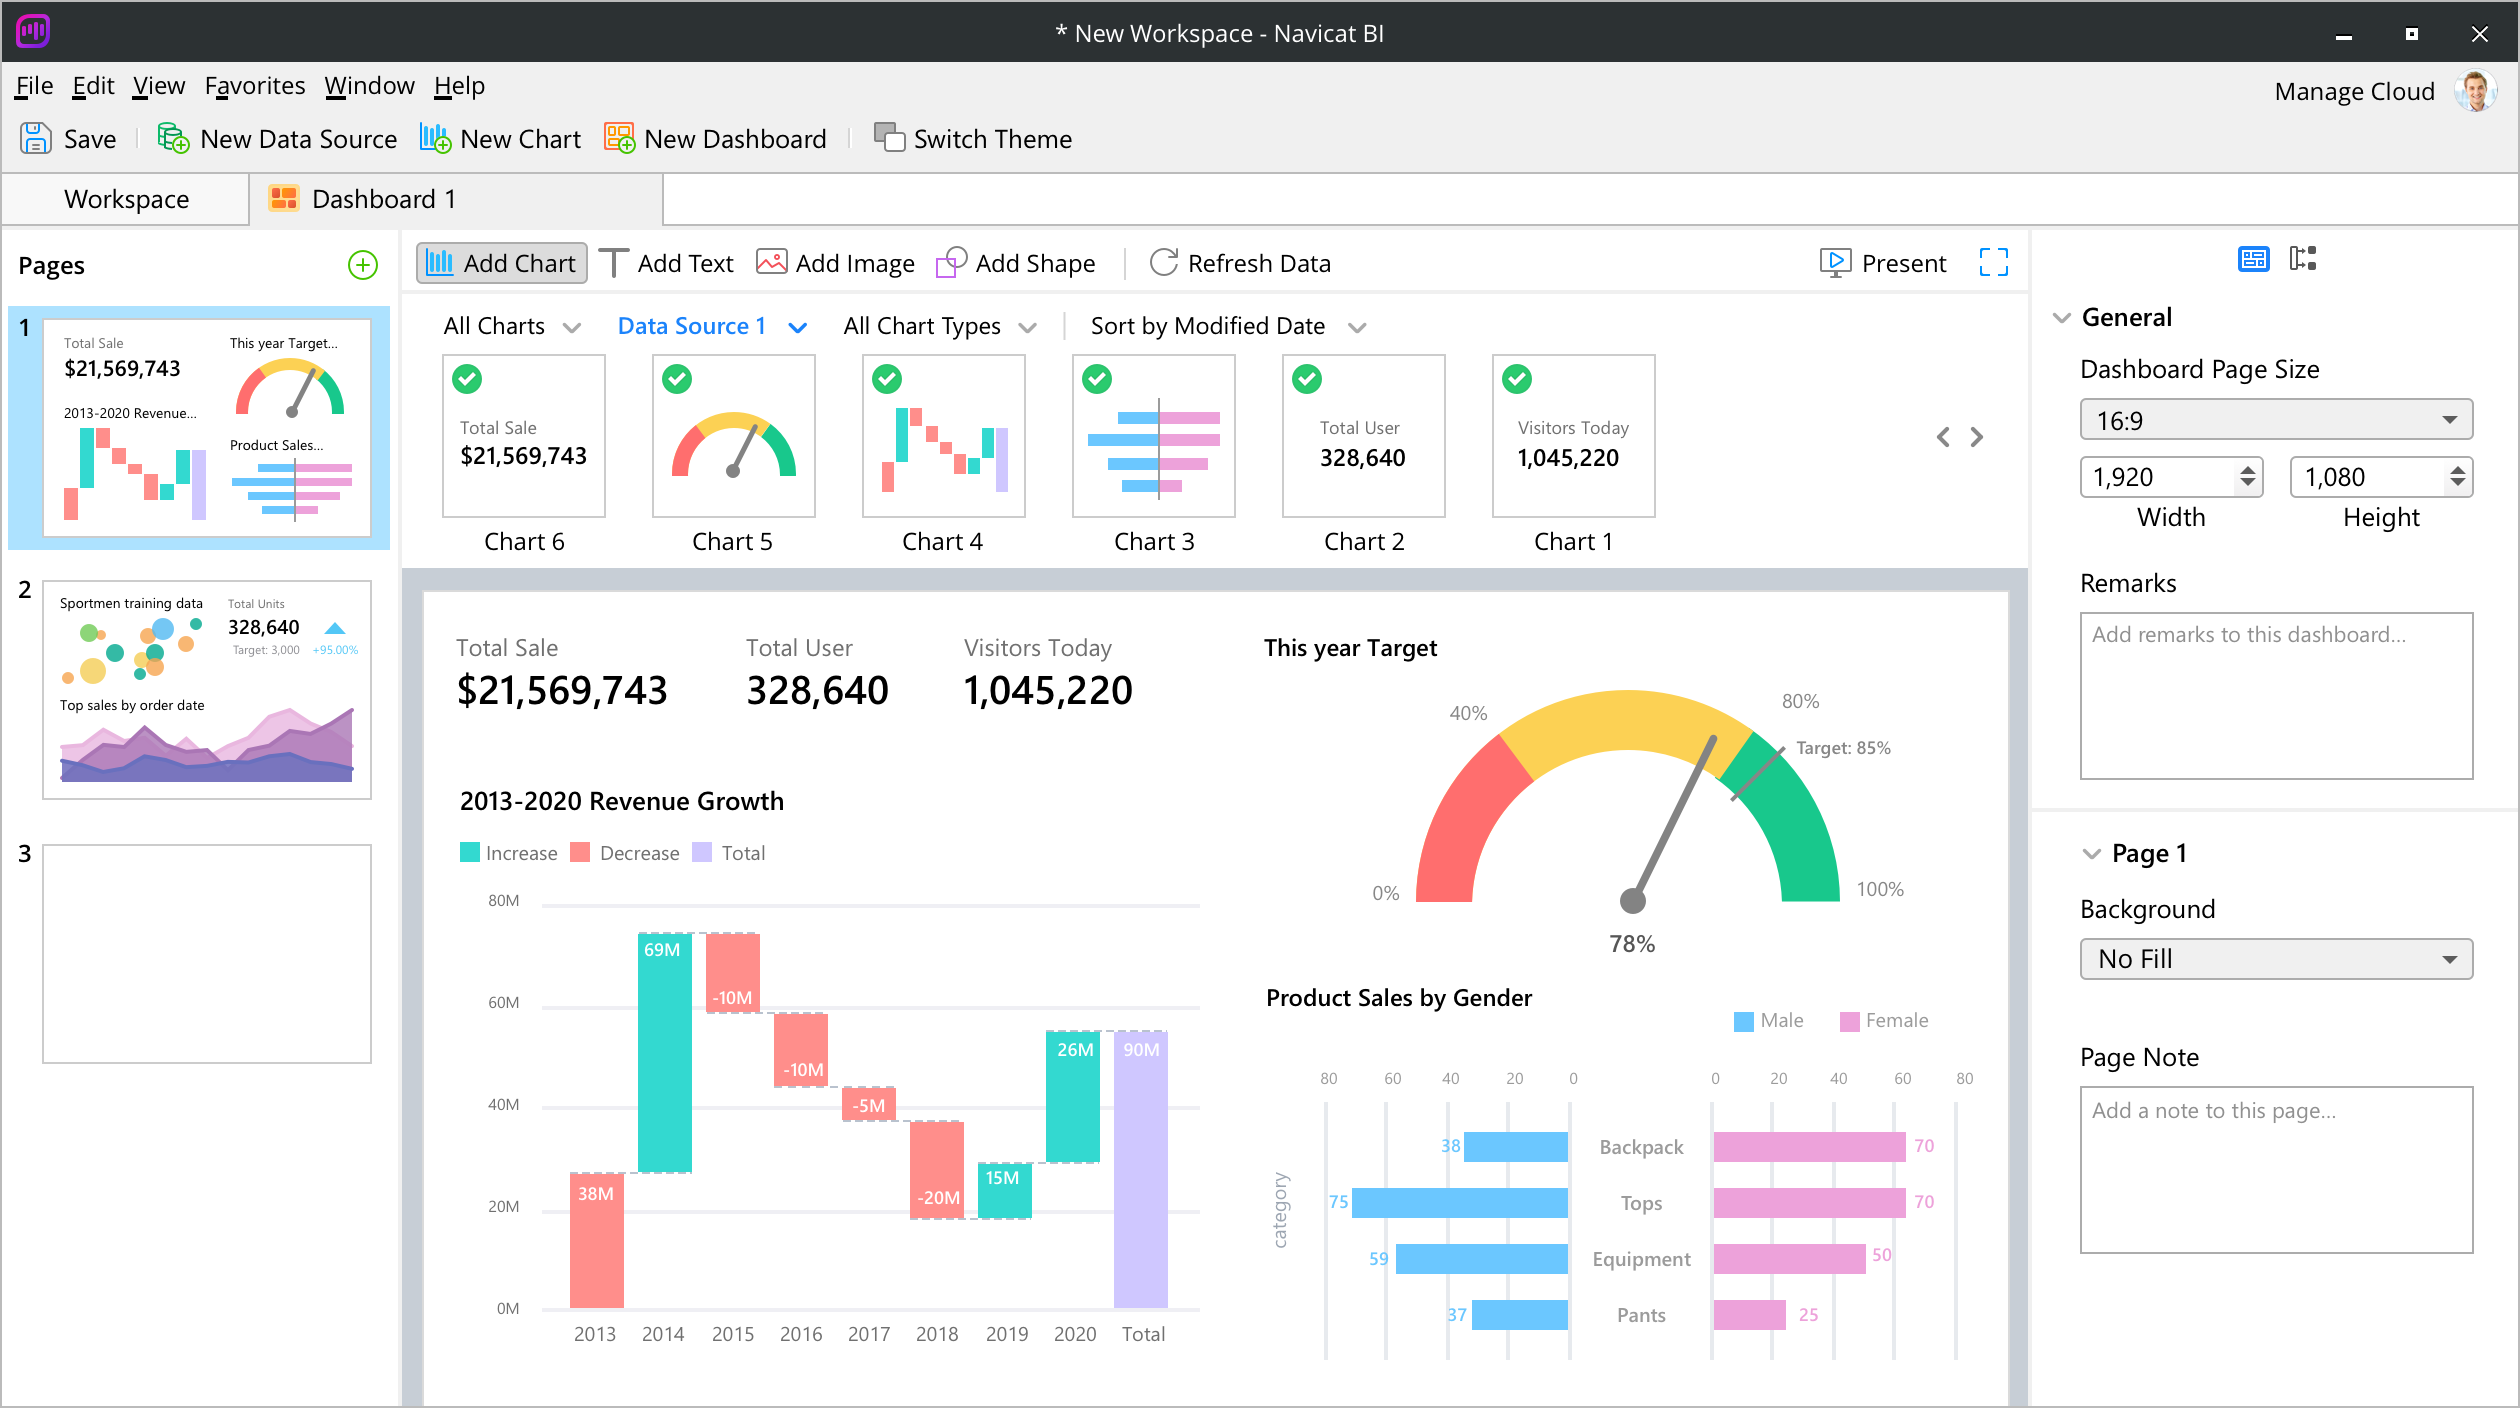
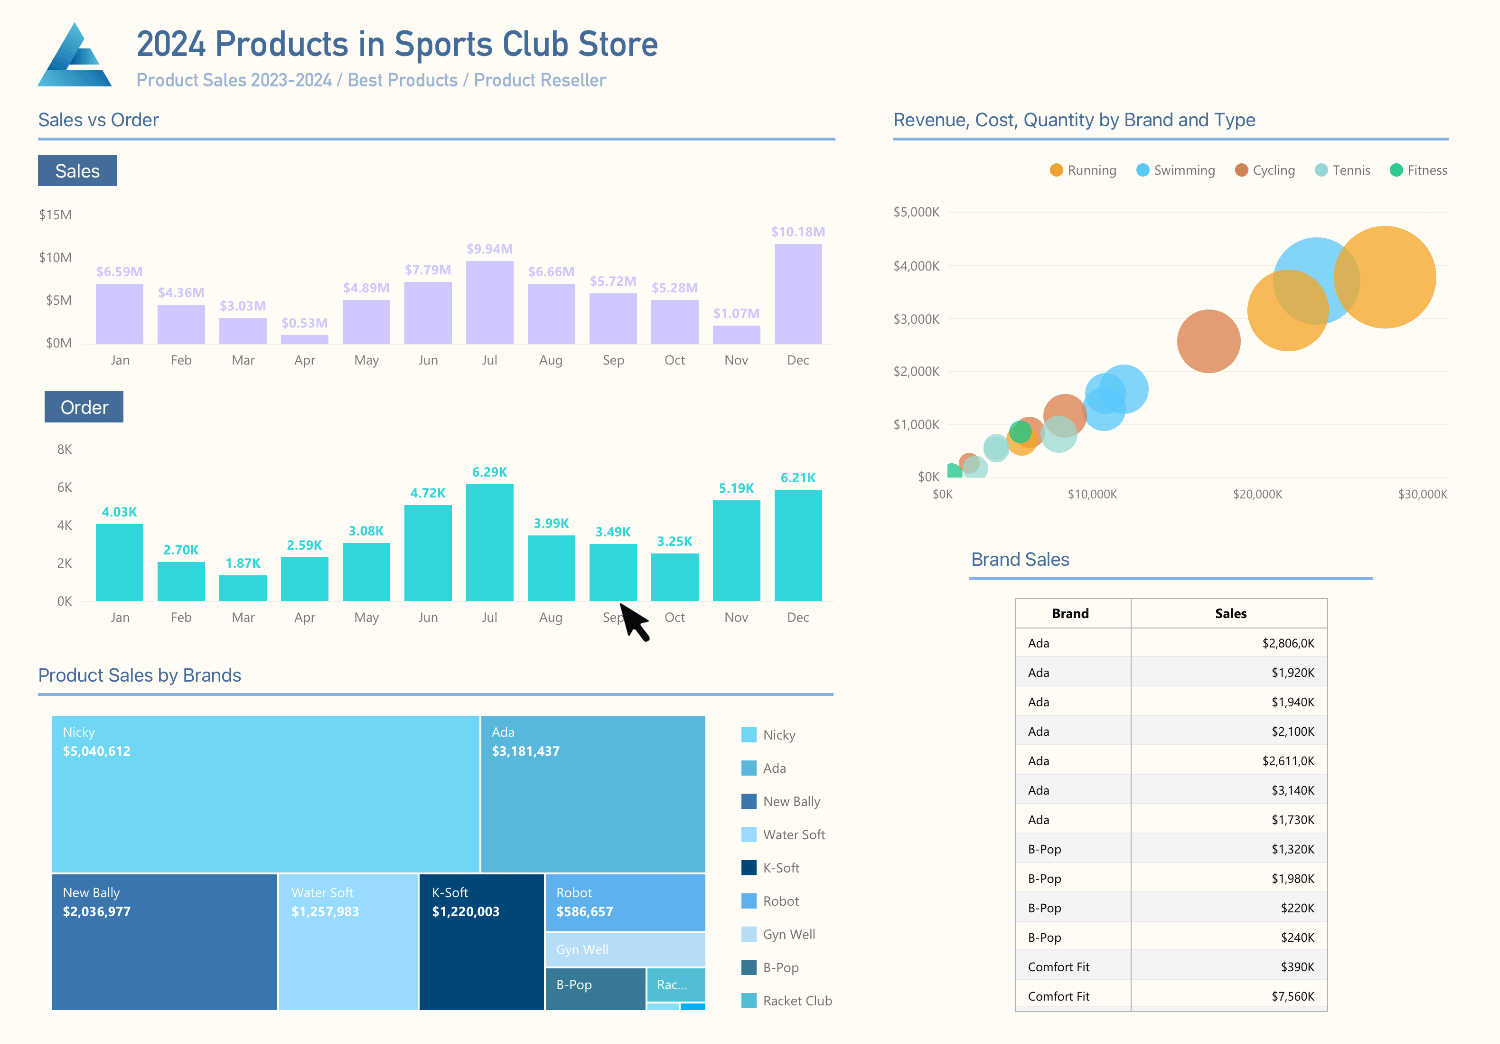
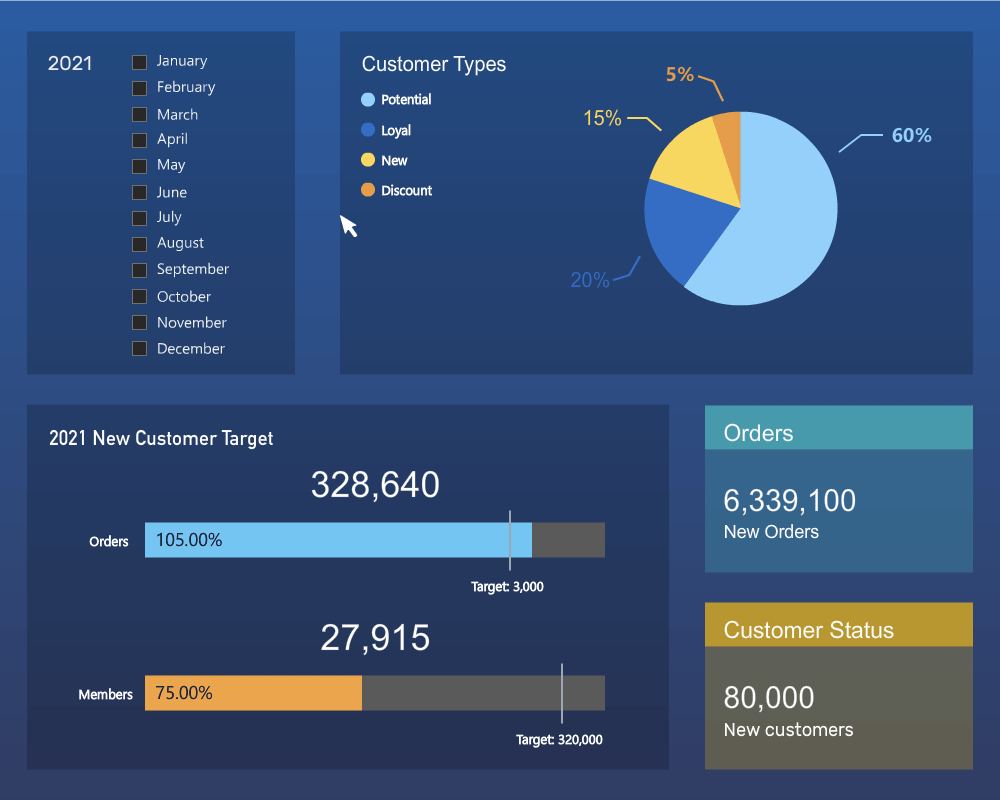
Transform your data into impactful visualizations during the data exploration and visualization phase of your Business Intelligence (BI) process. By simplifying data analysis and leveraging interactive dashboards, you can easily share your workspaces with colleagues, facilitating collaborative decision-making and aligning your business strategies with data-driven intelligence.


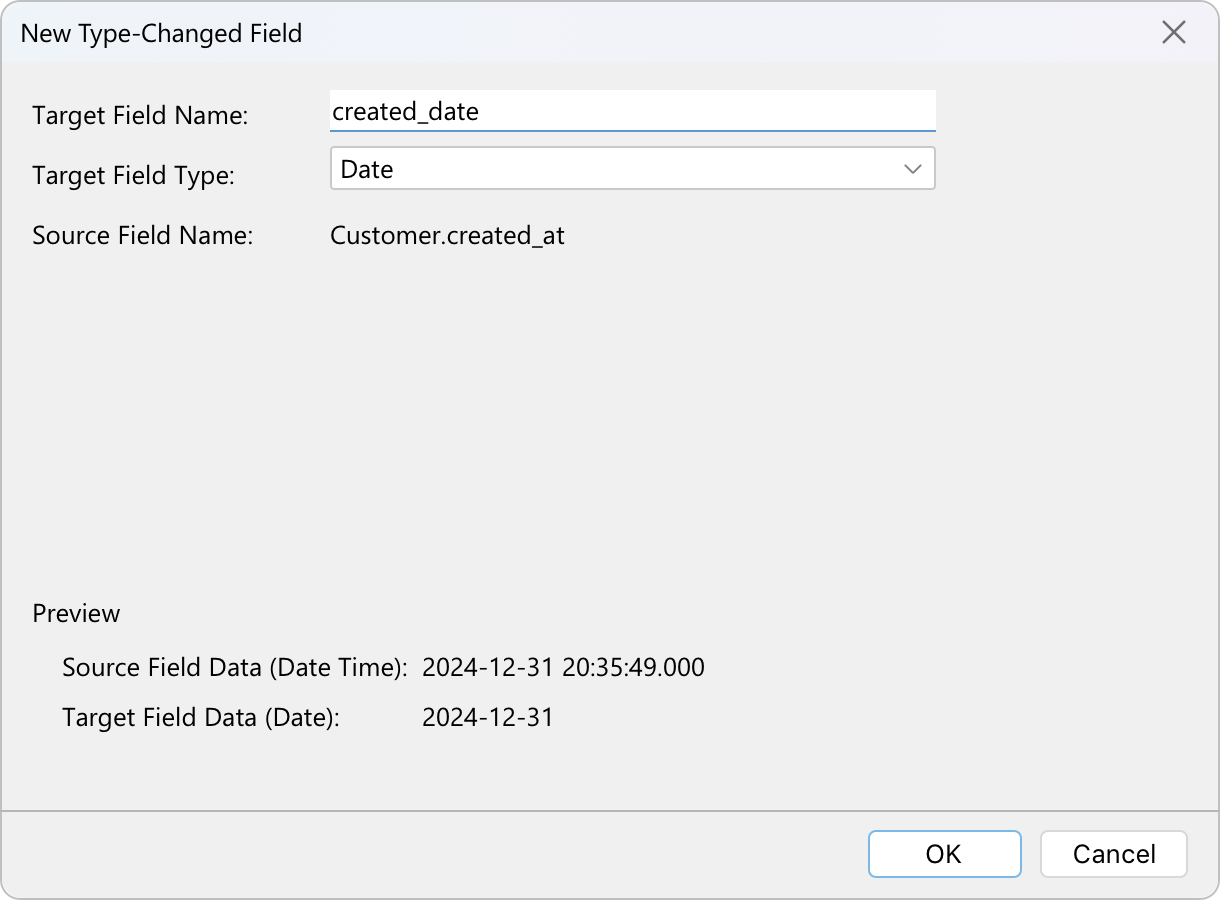
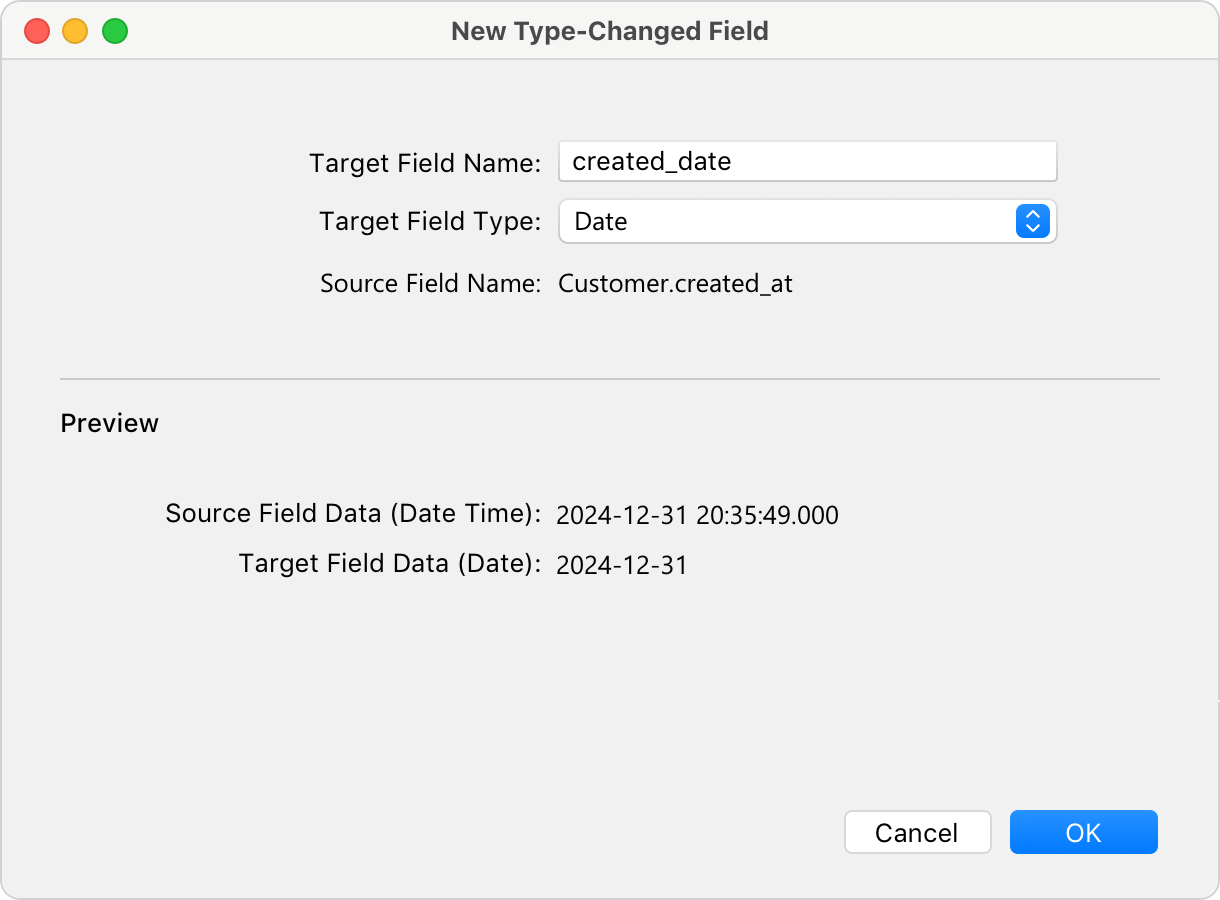
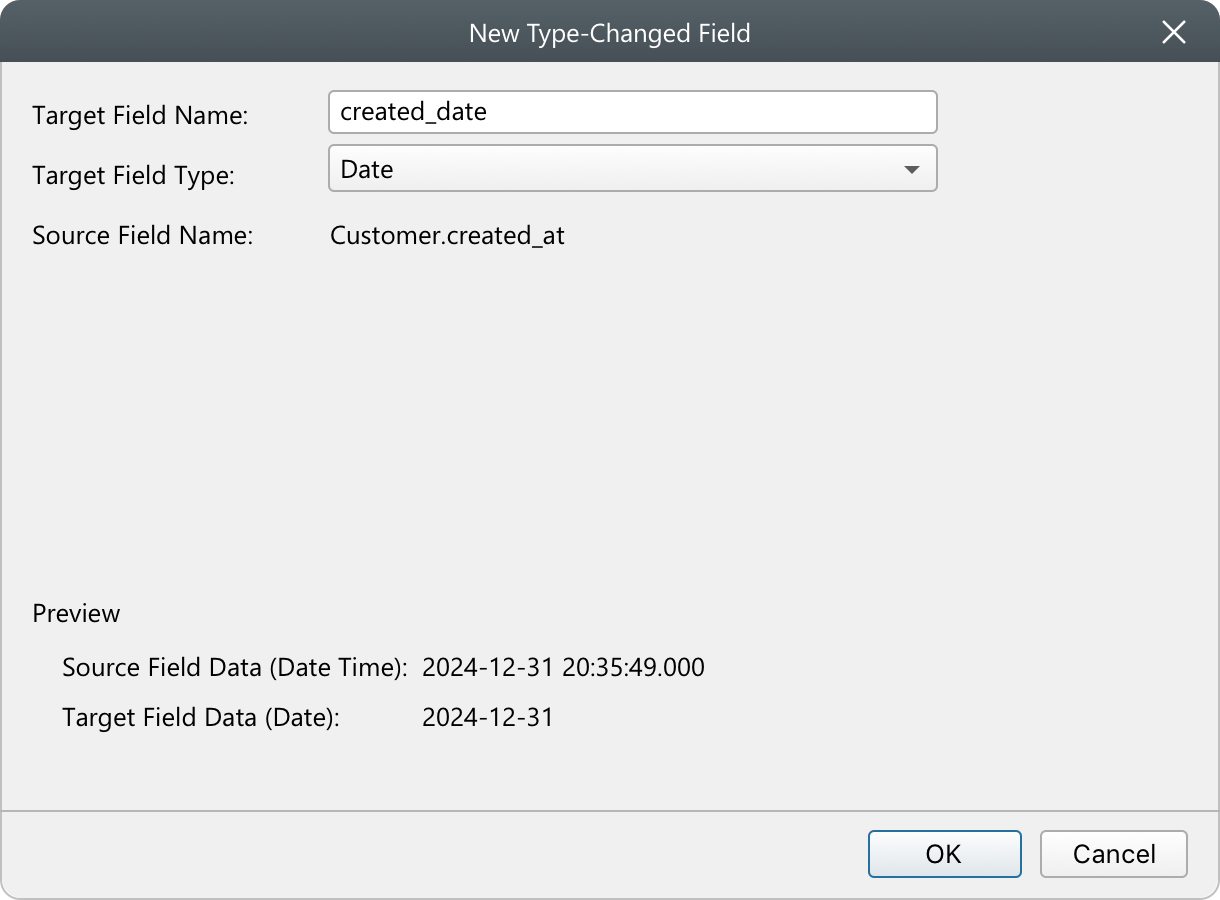
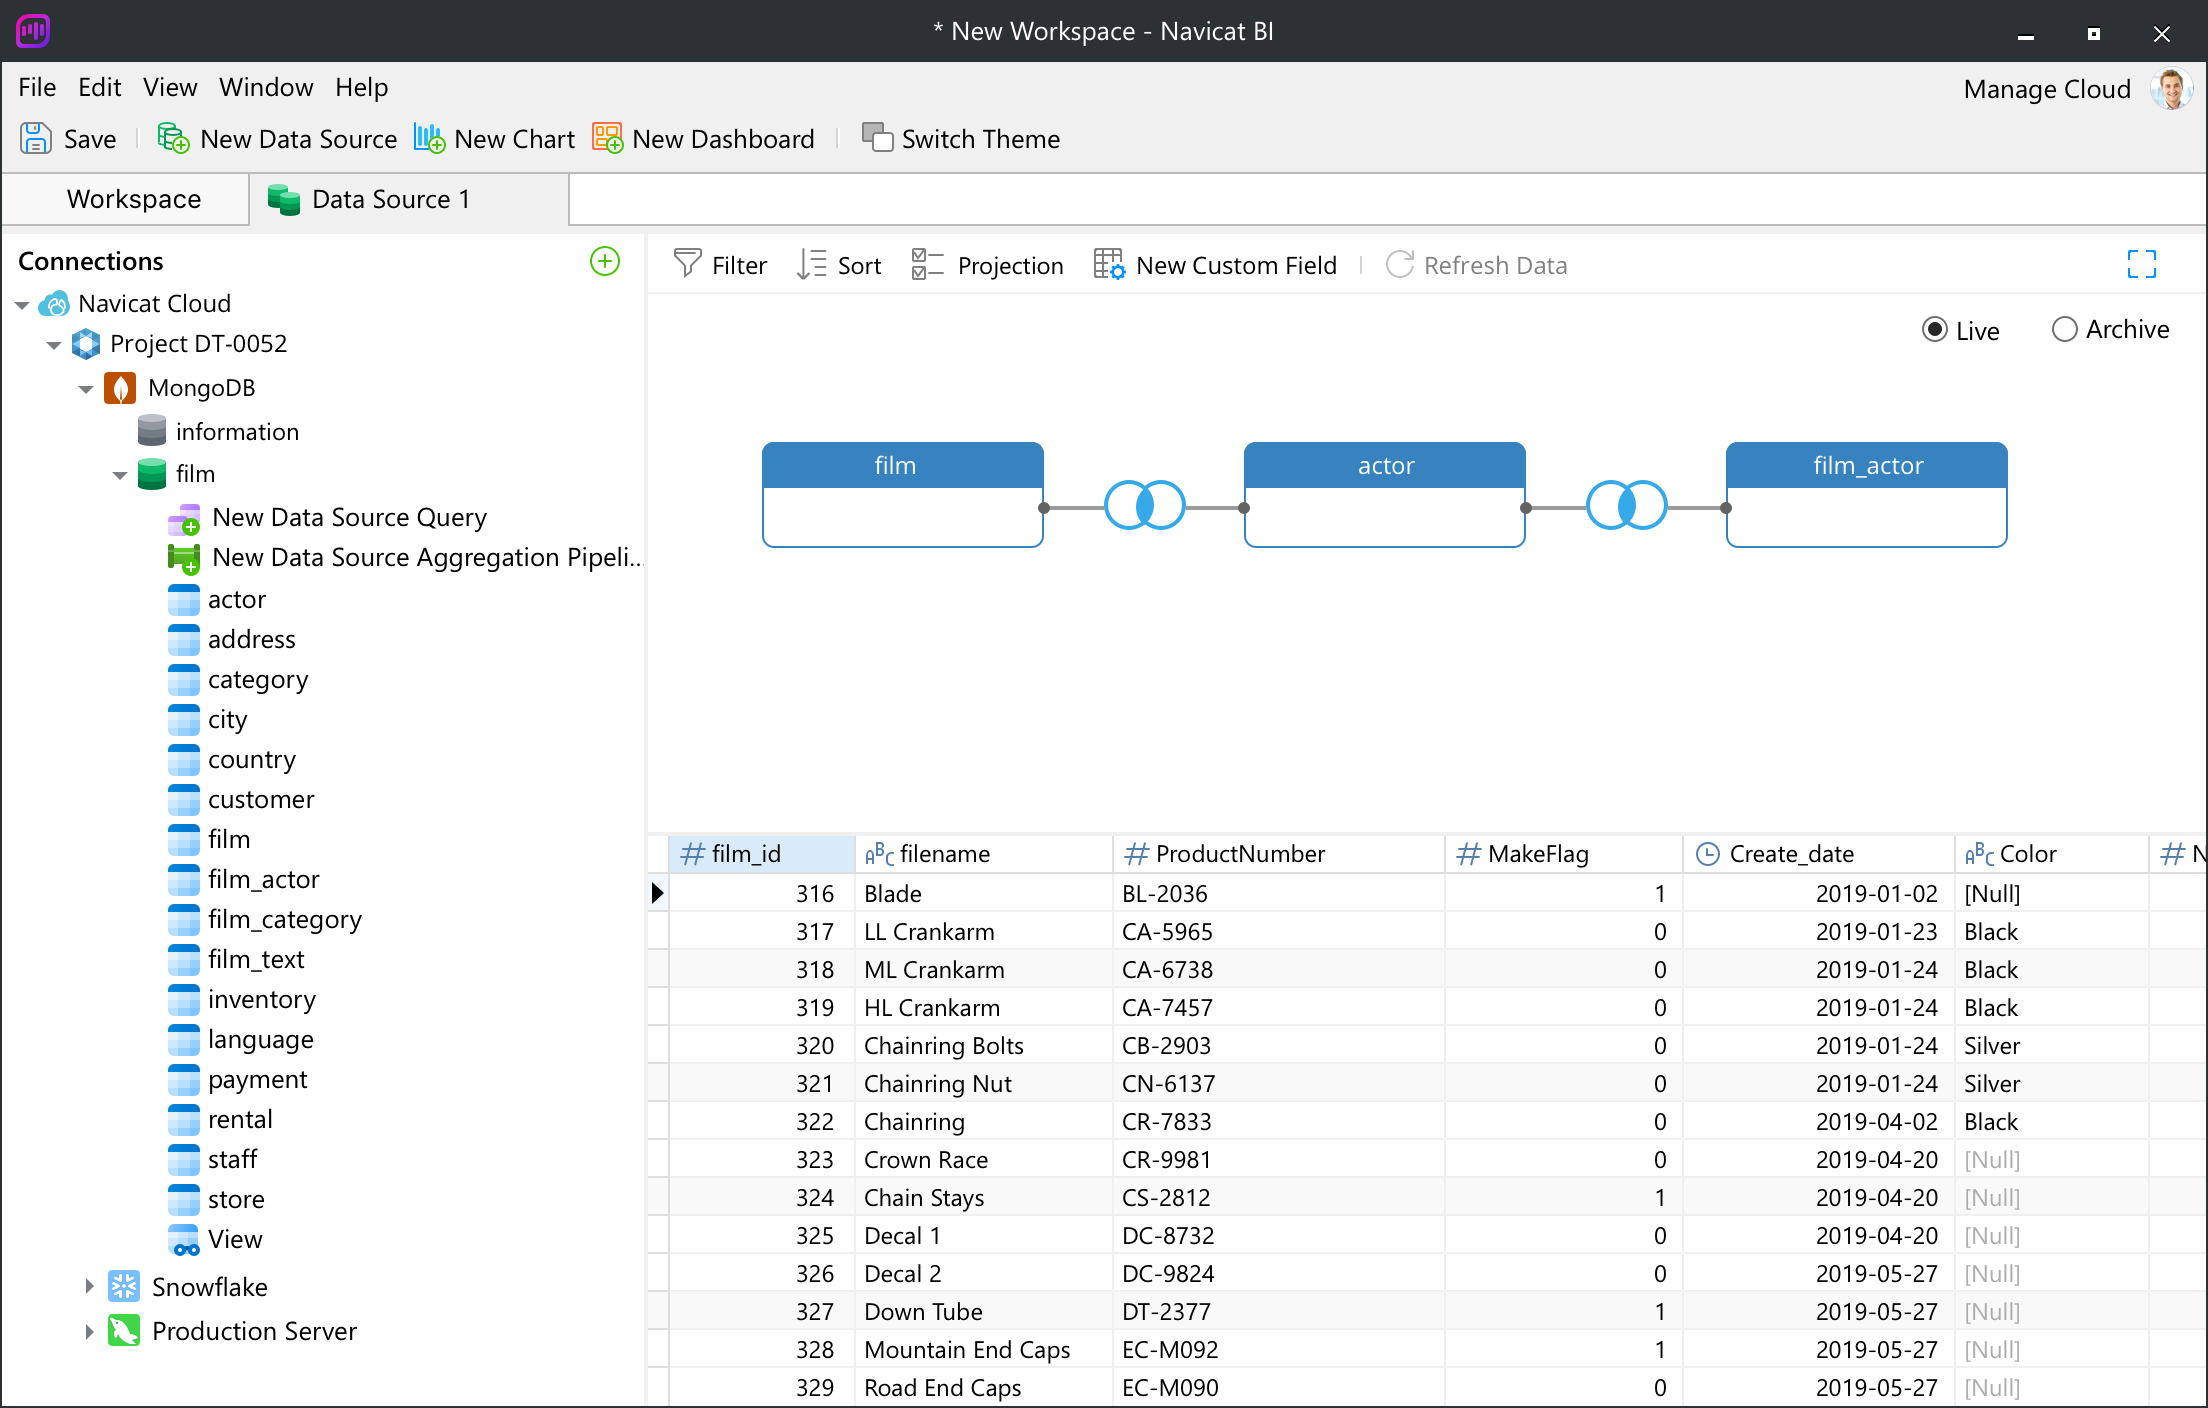
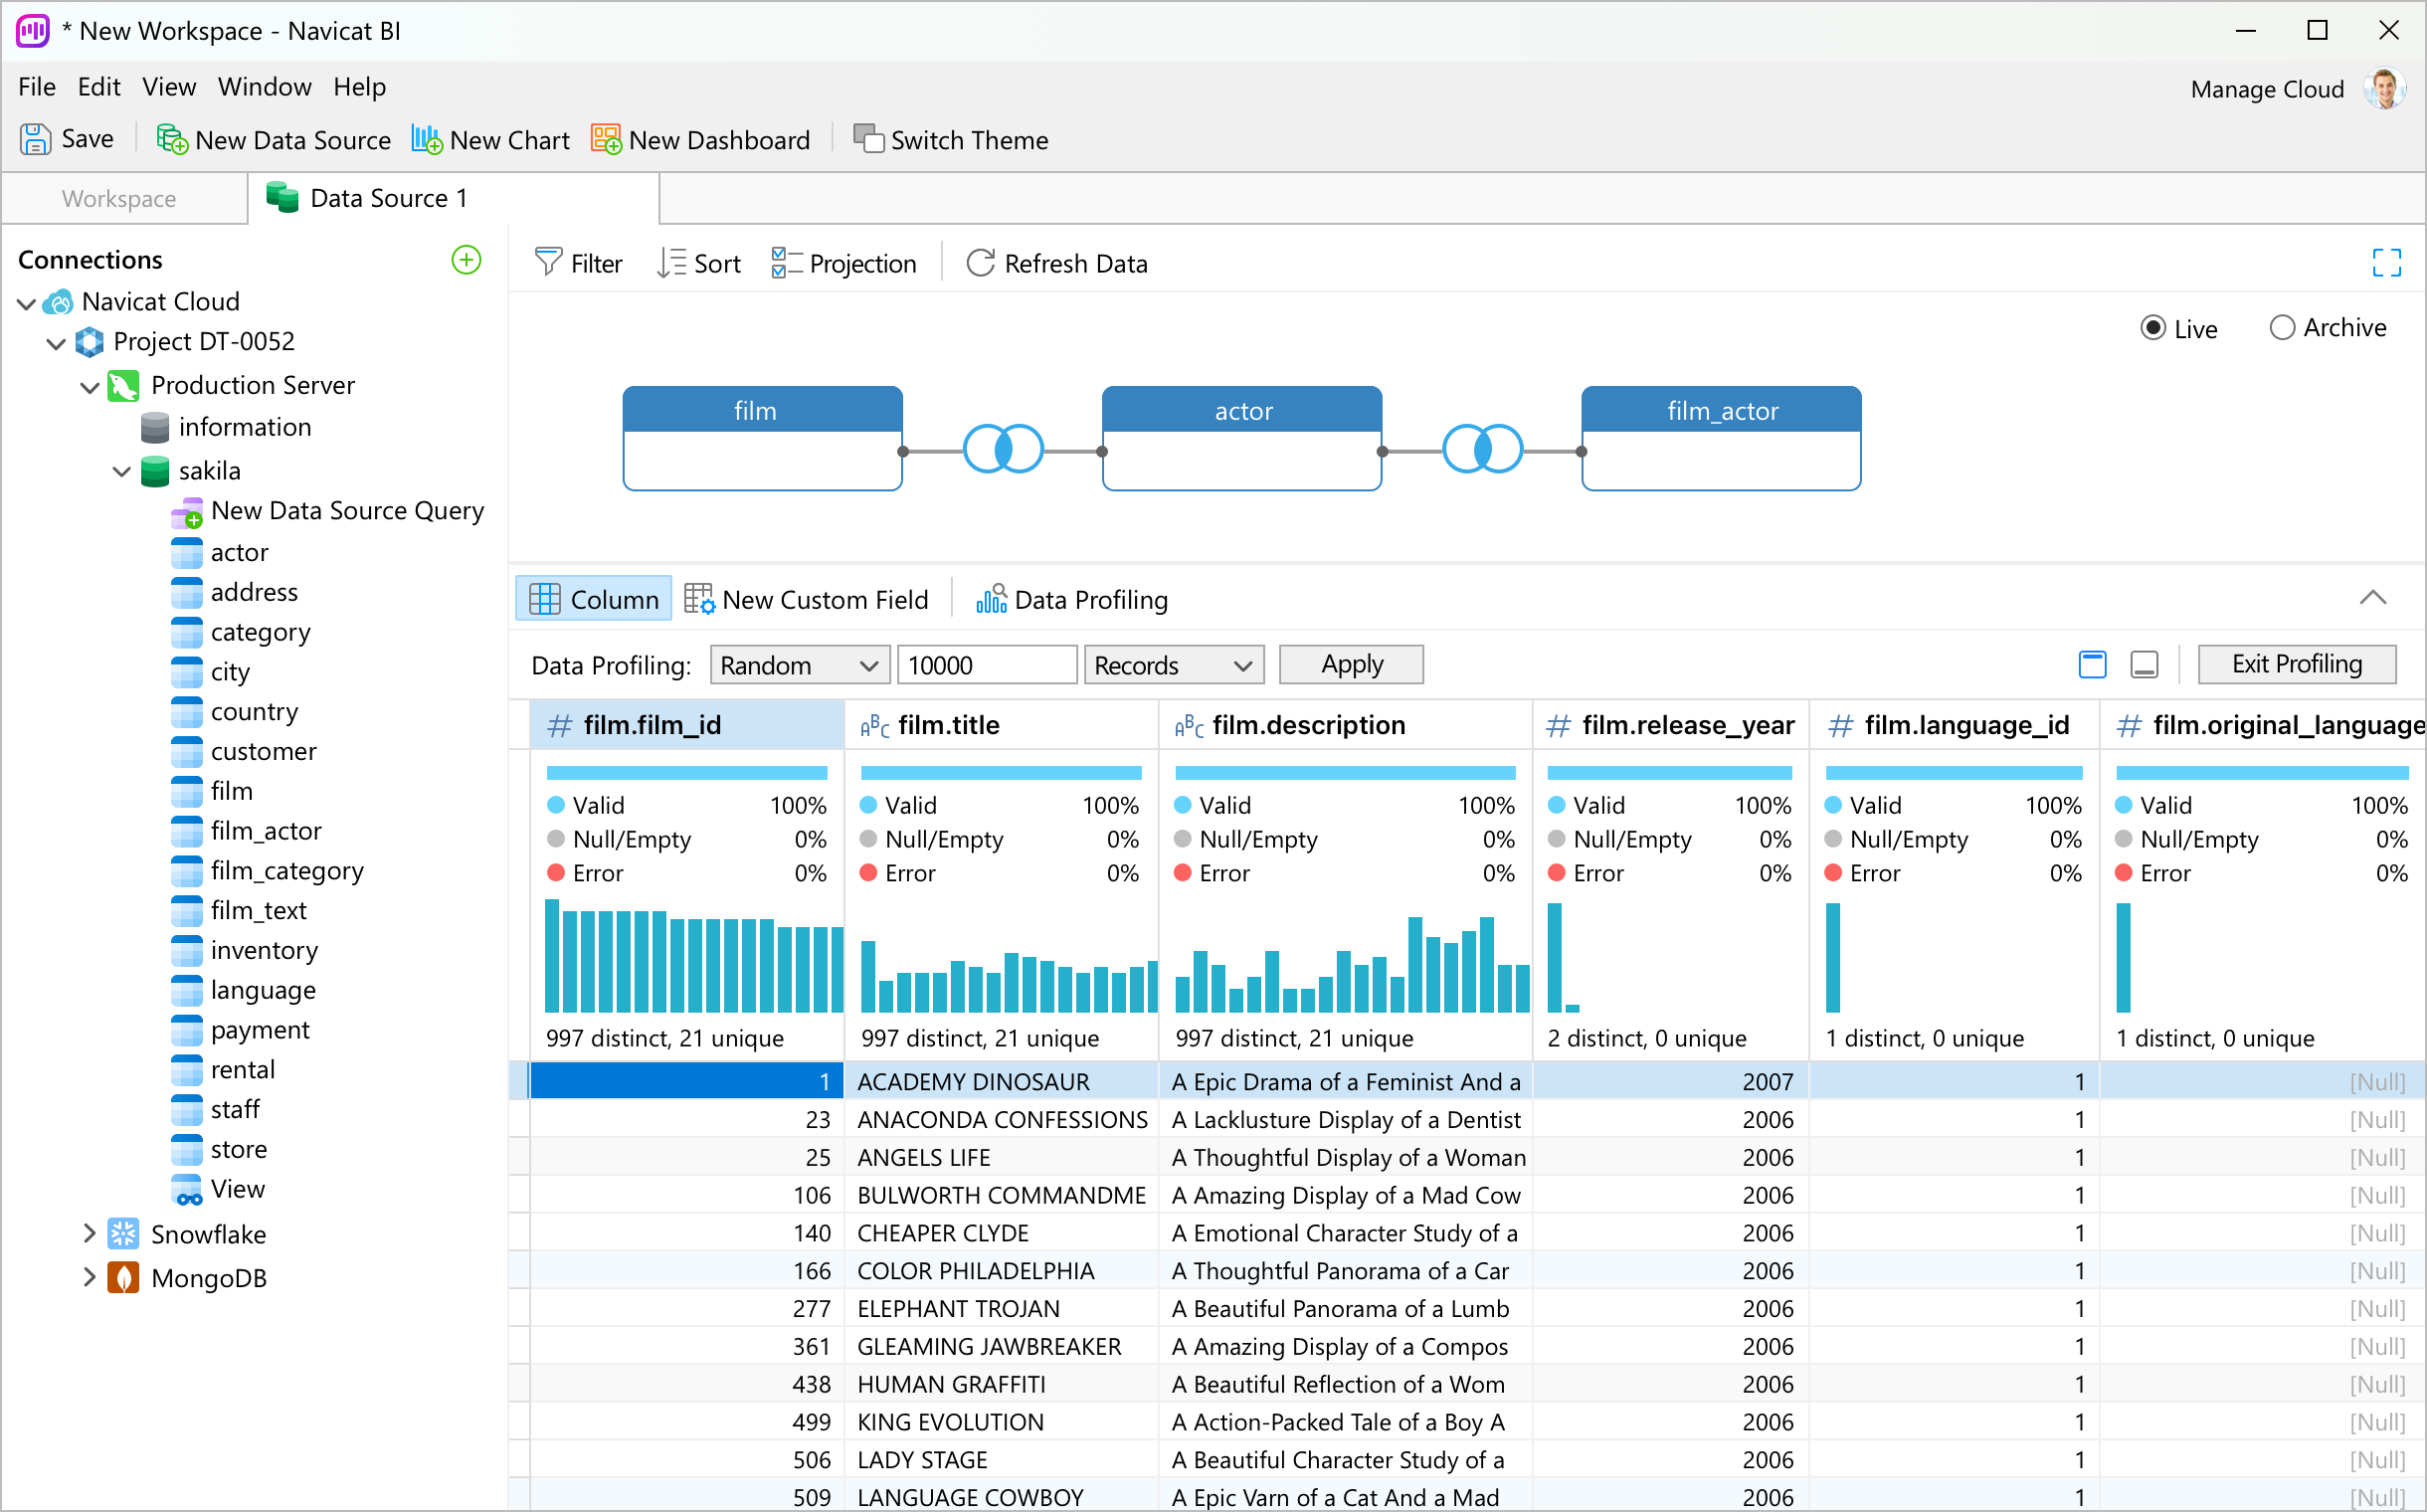
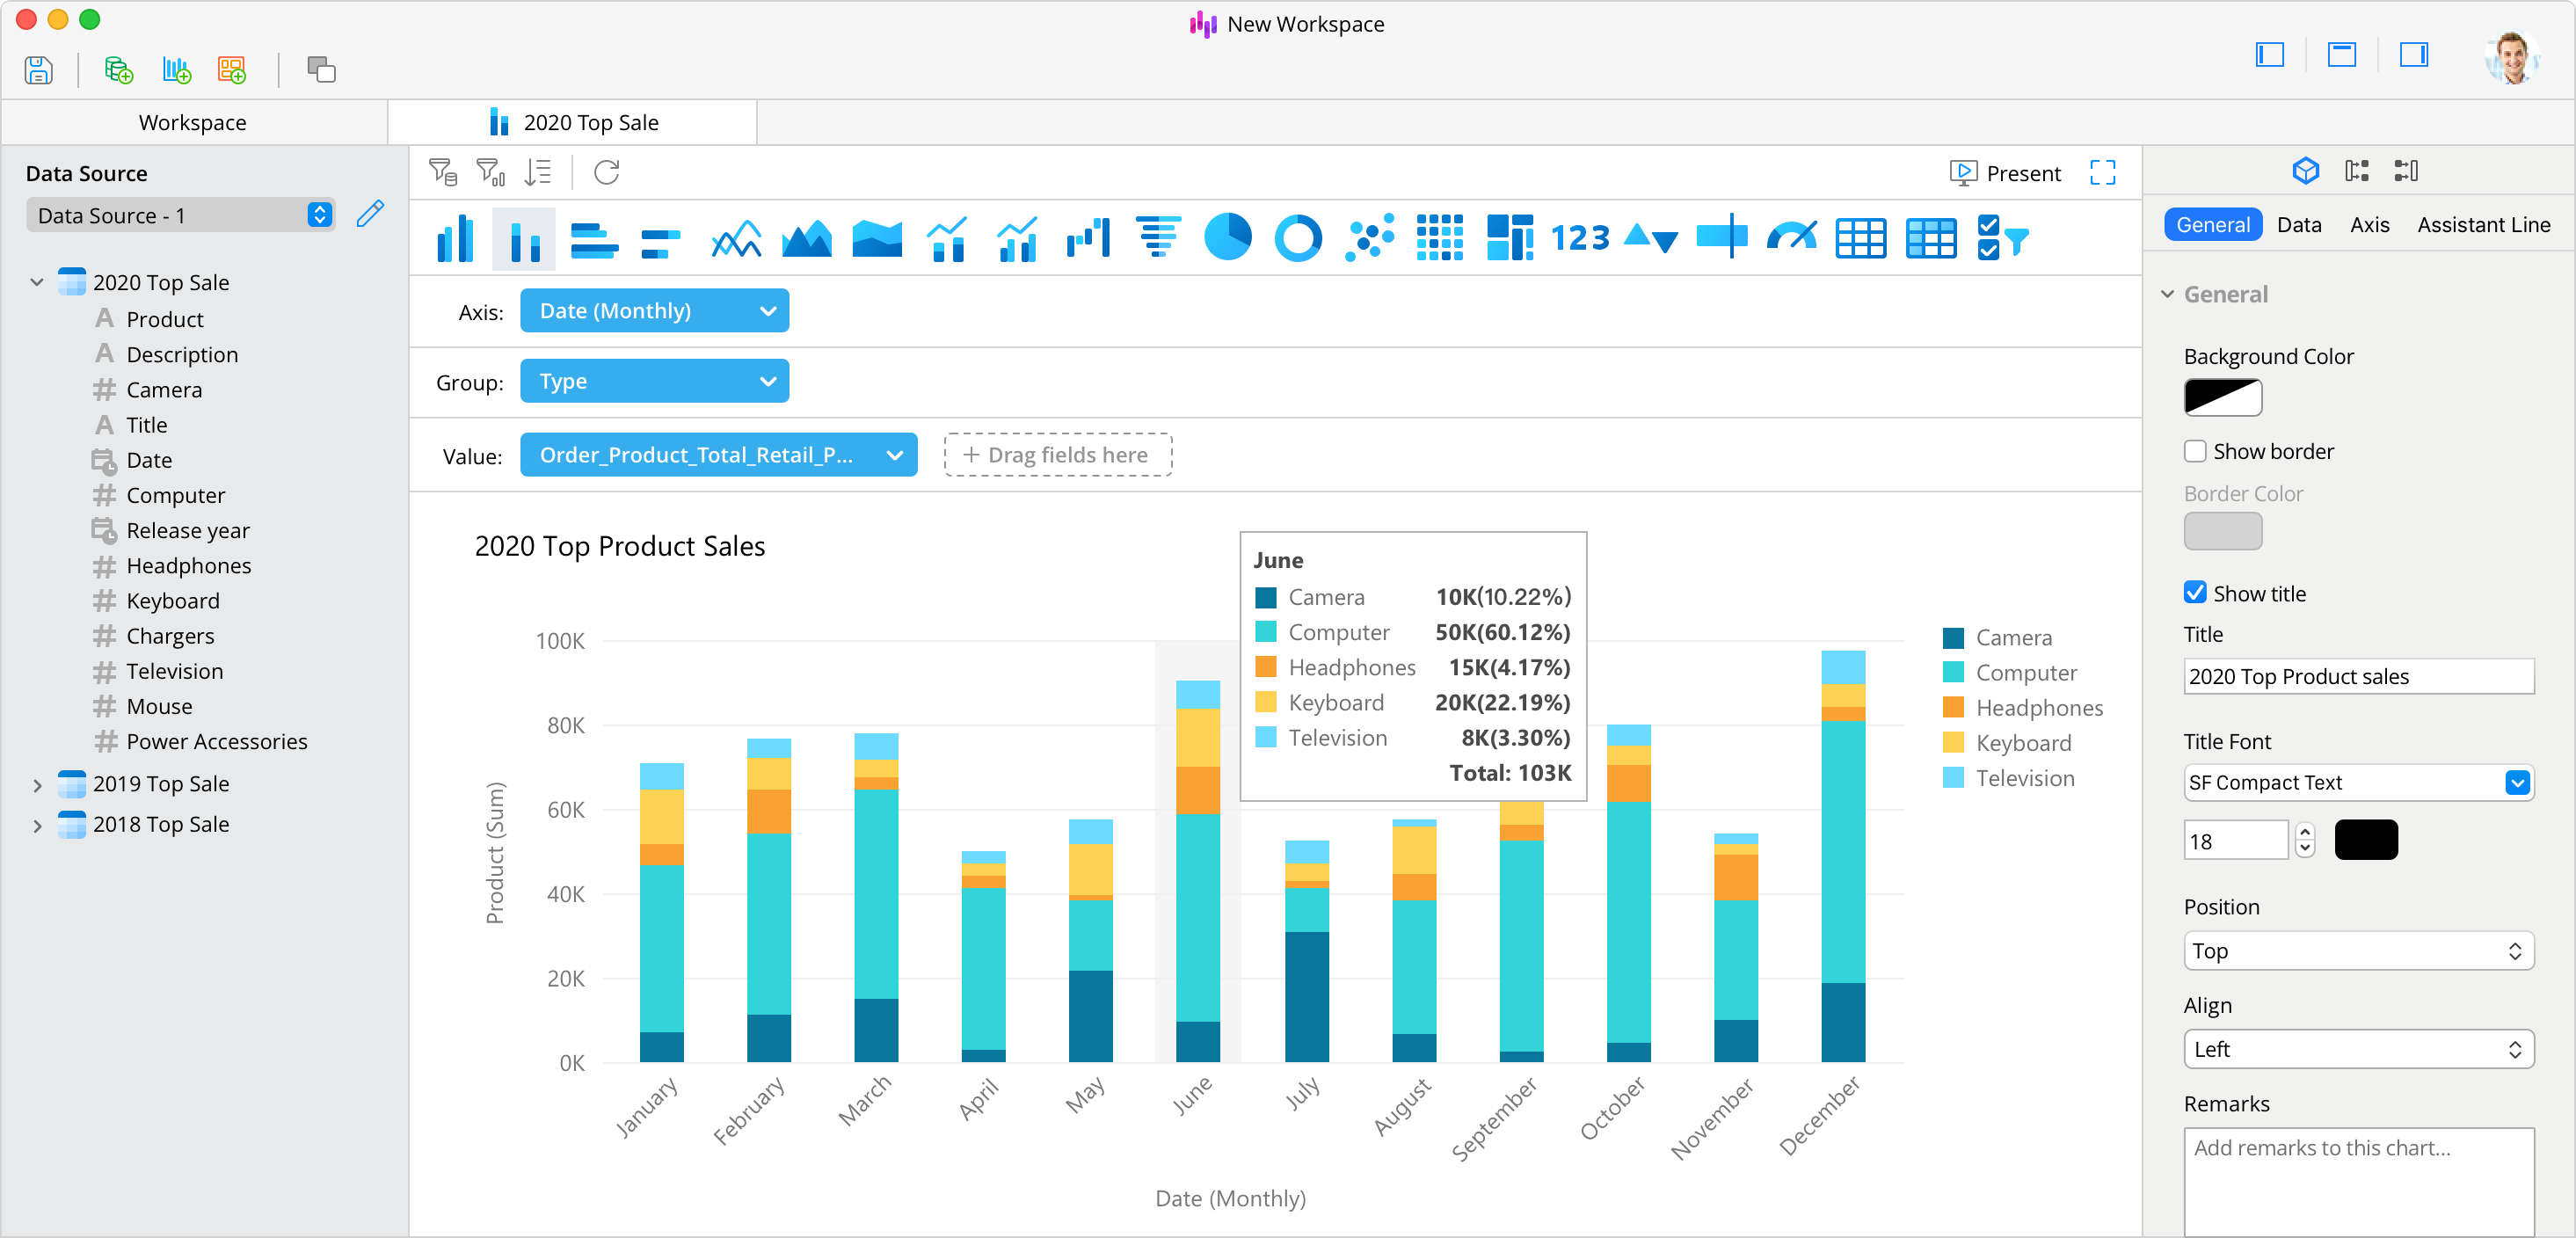
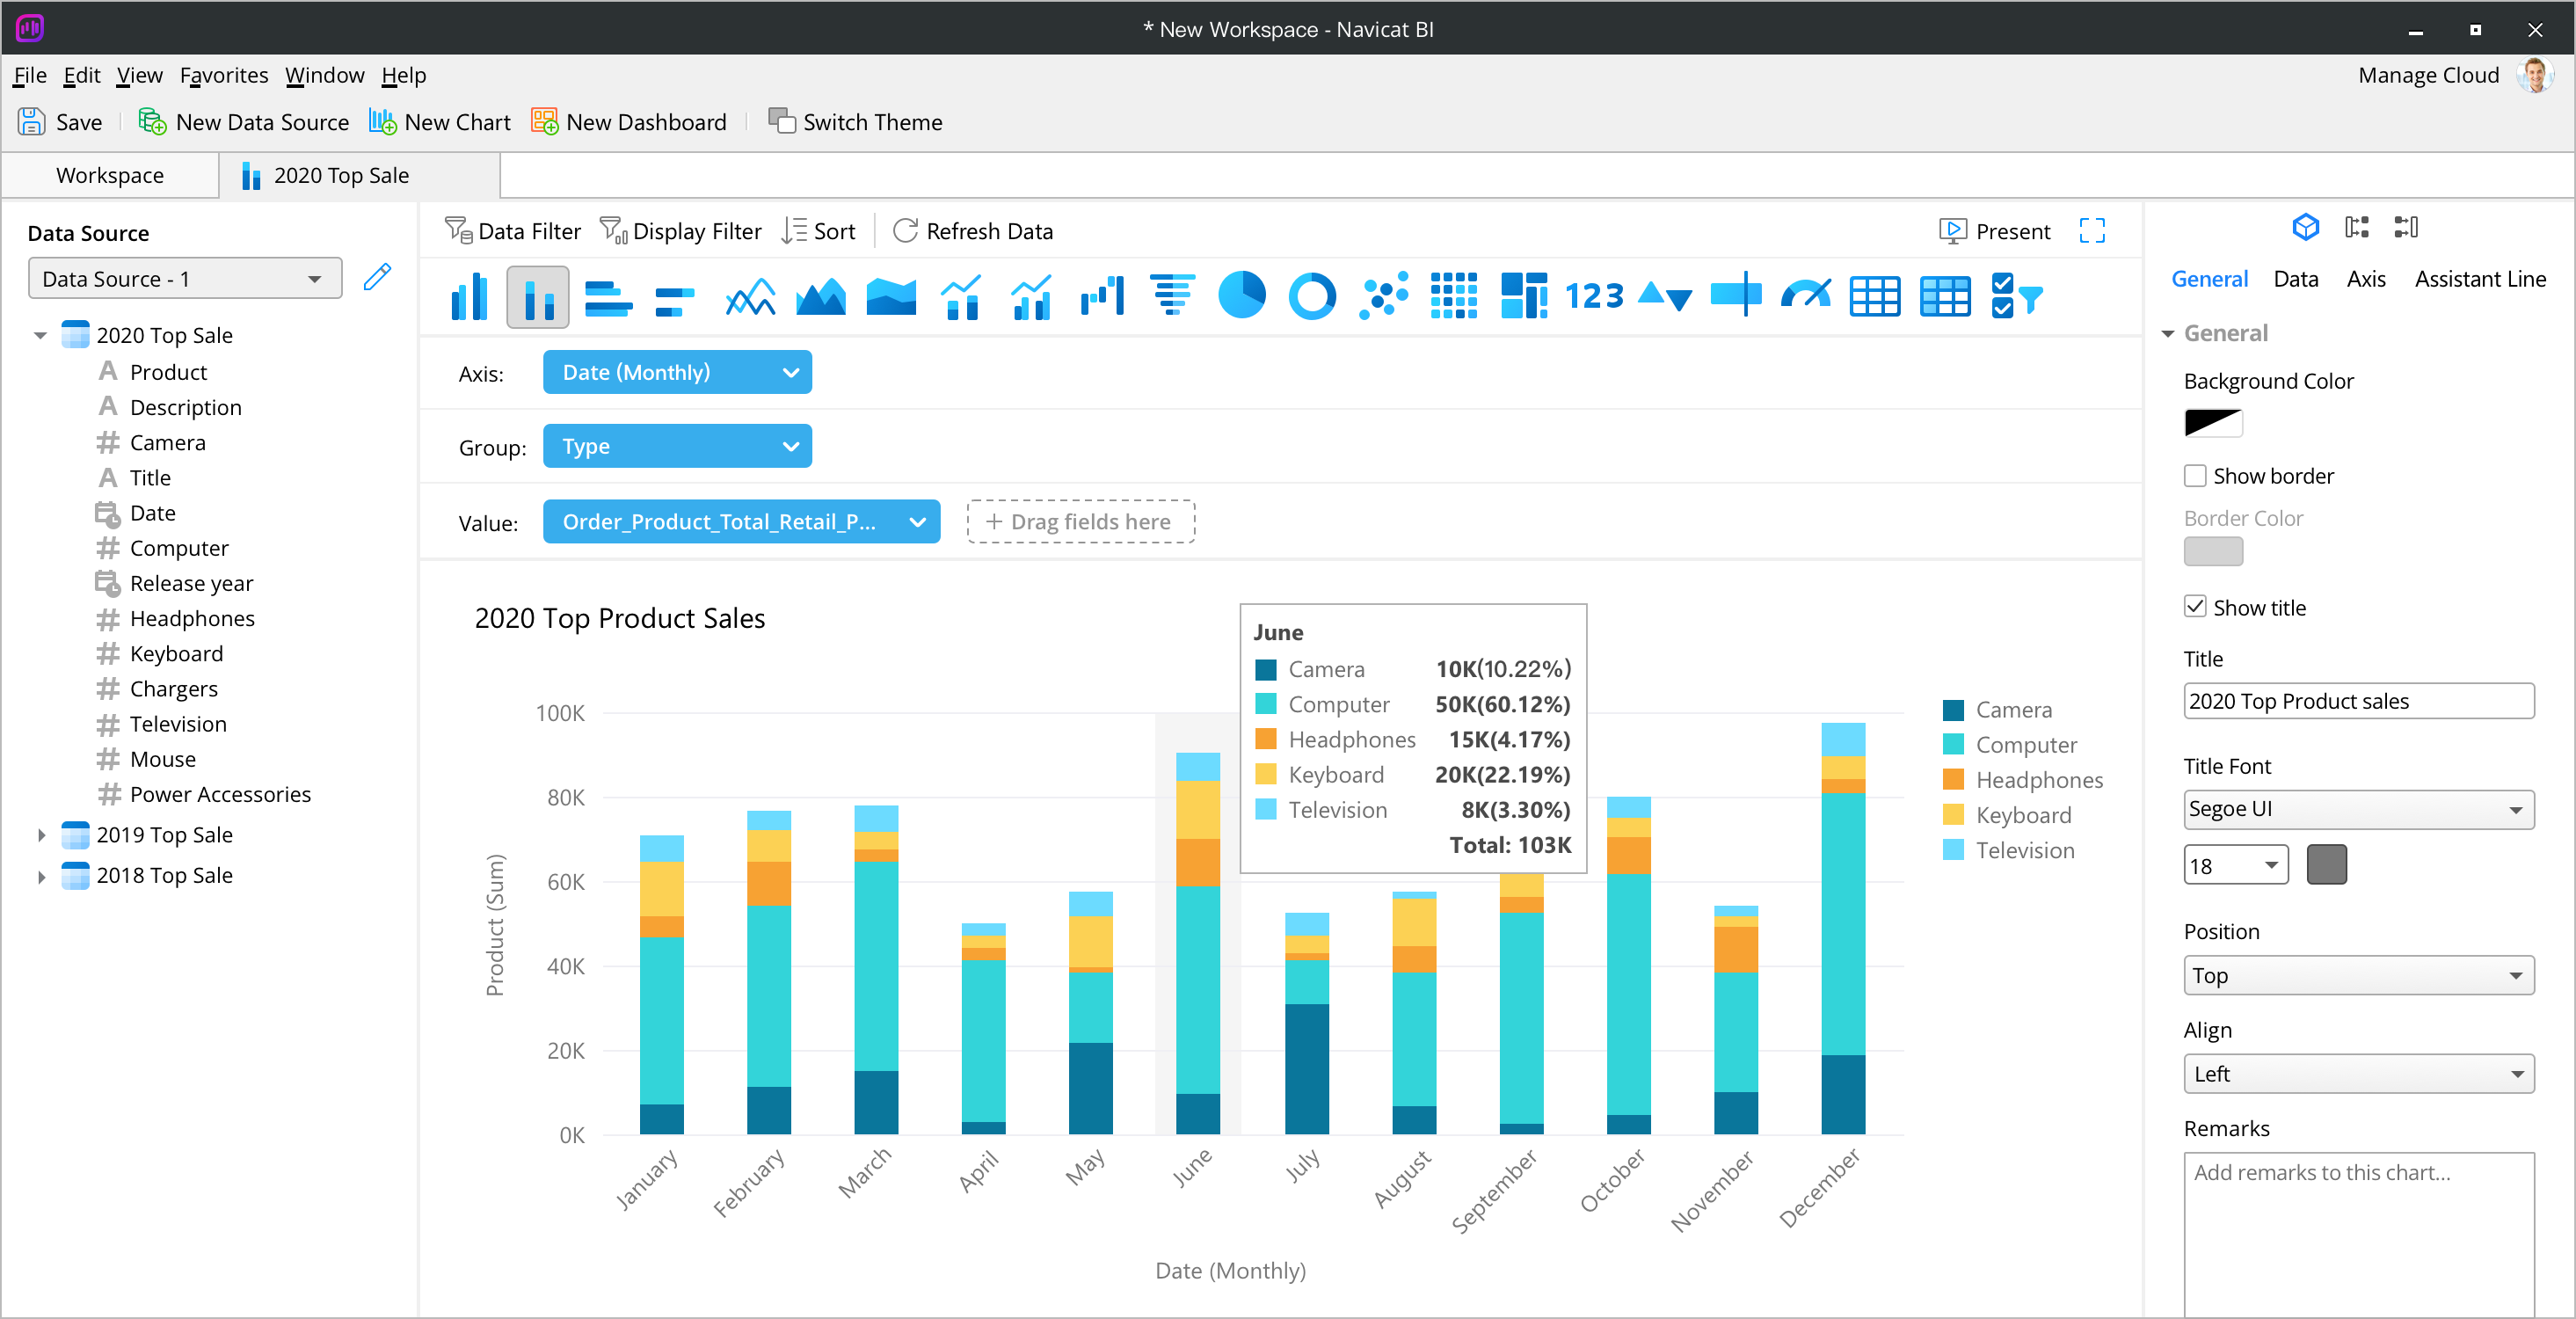
Convert the data type of a field to ensure accurate representation and appropriate analysis in a chart.
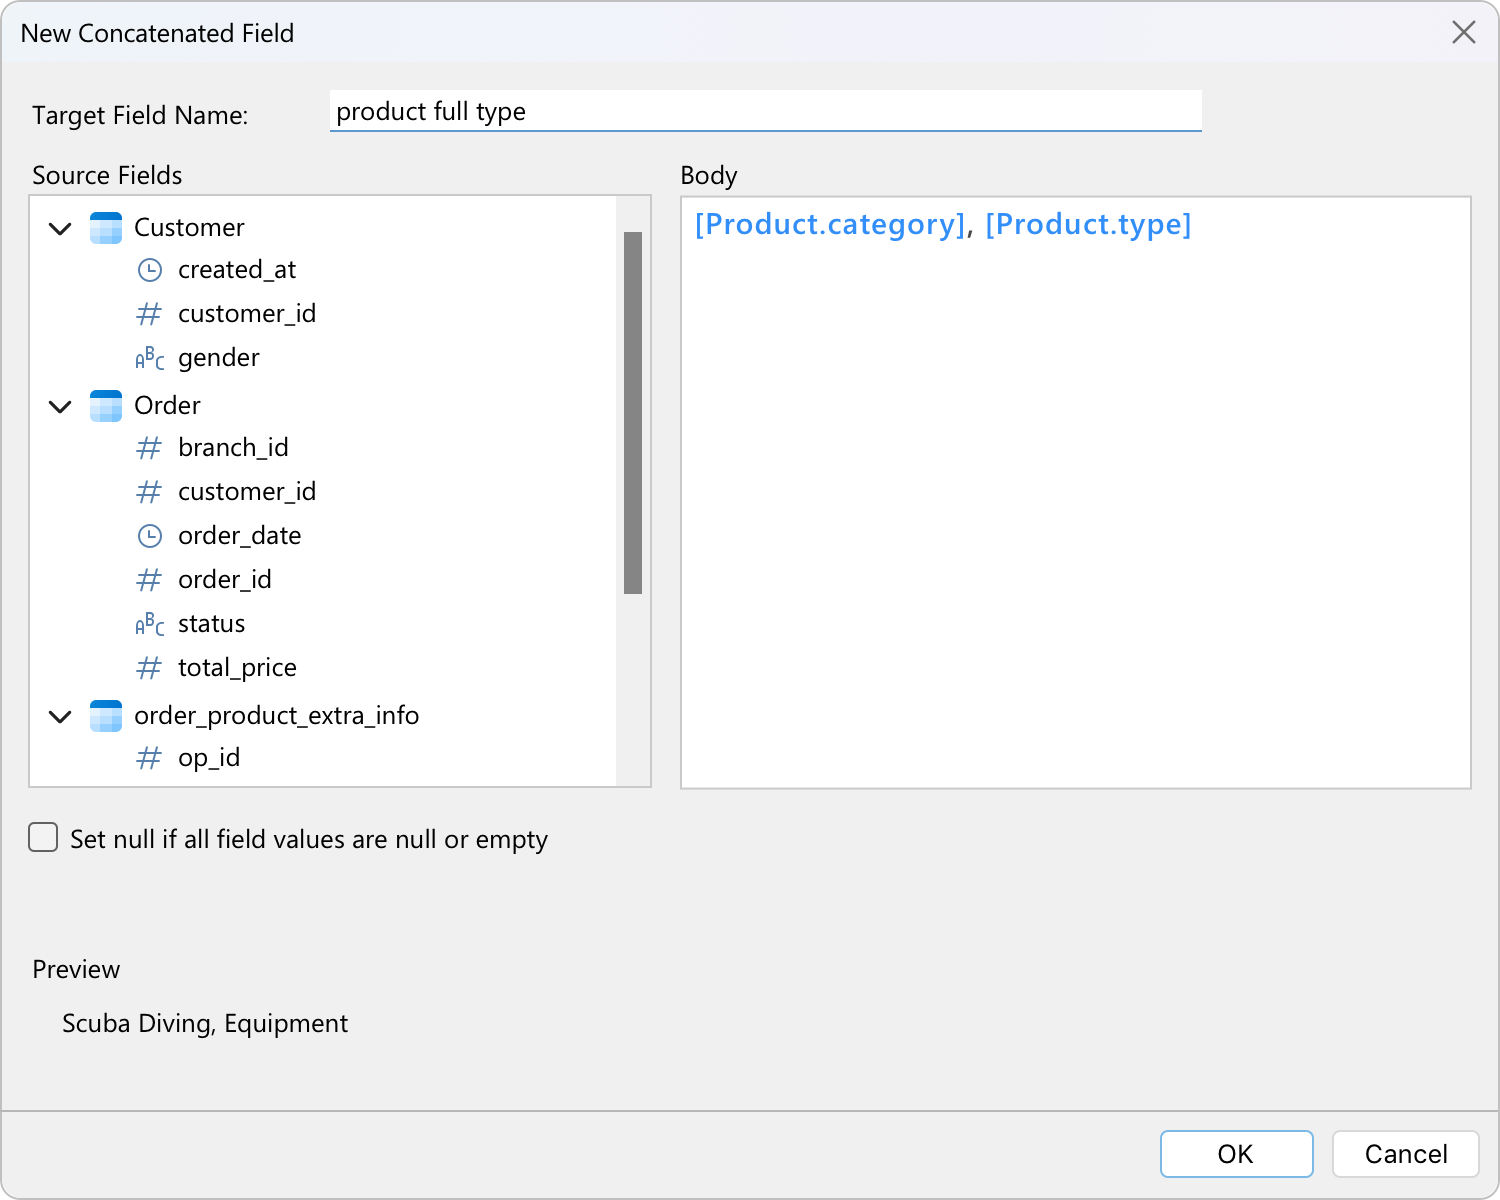
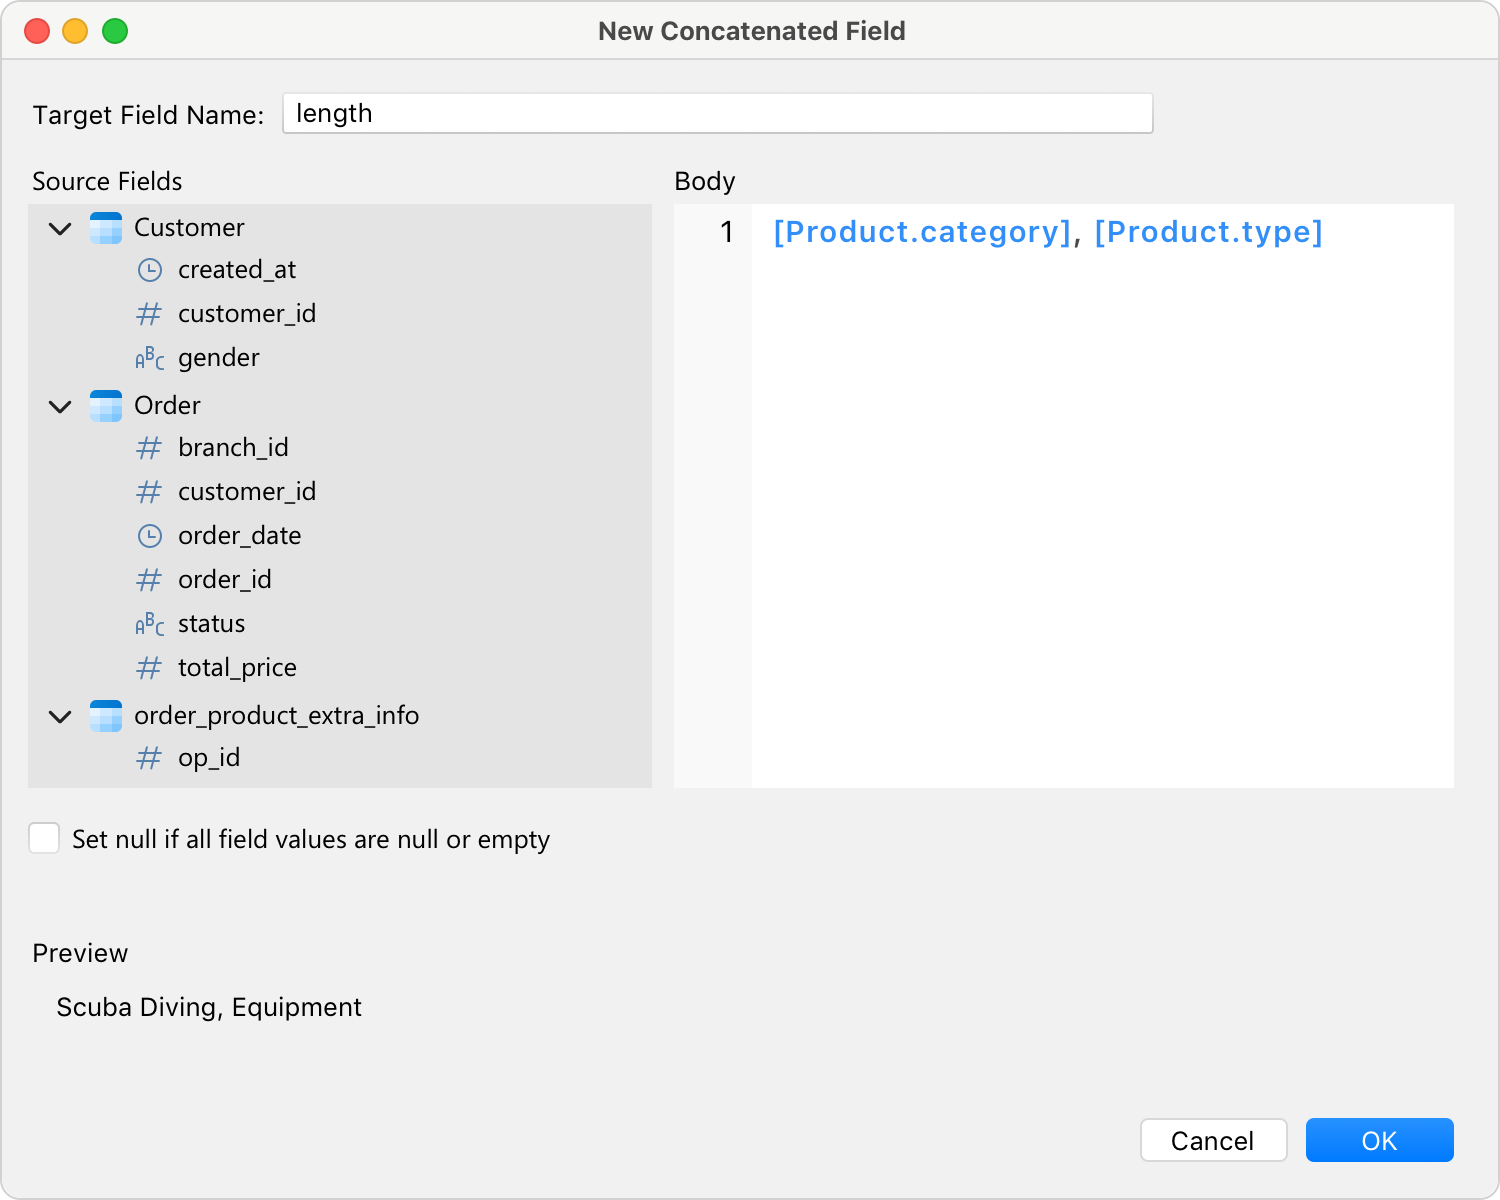
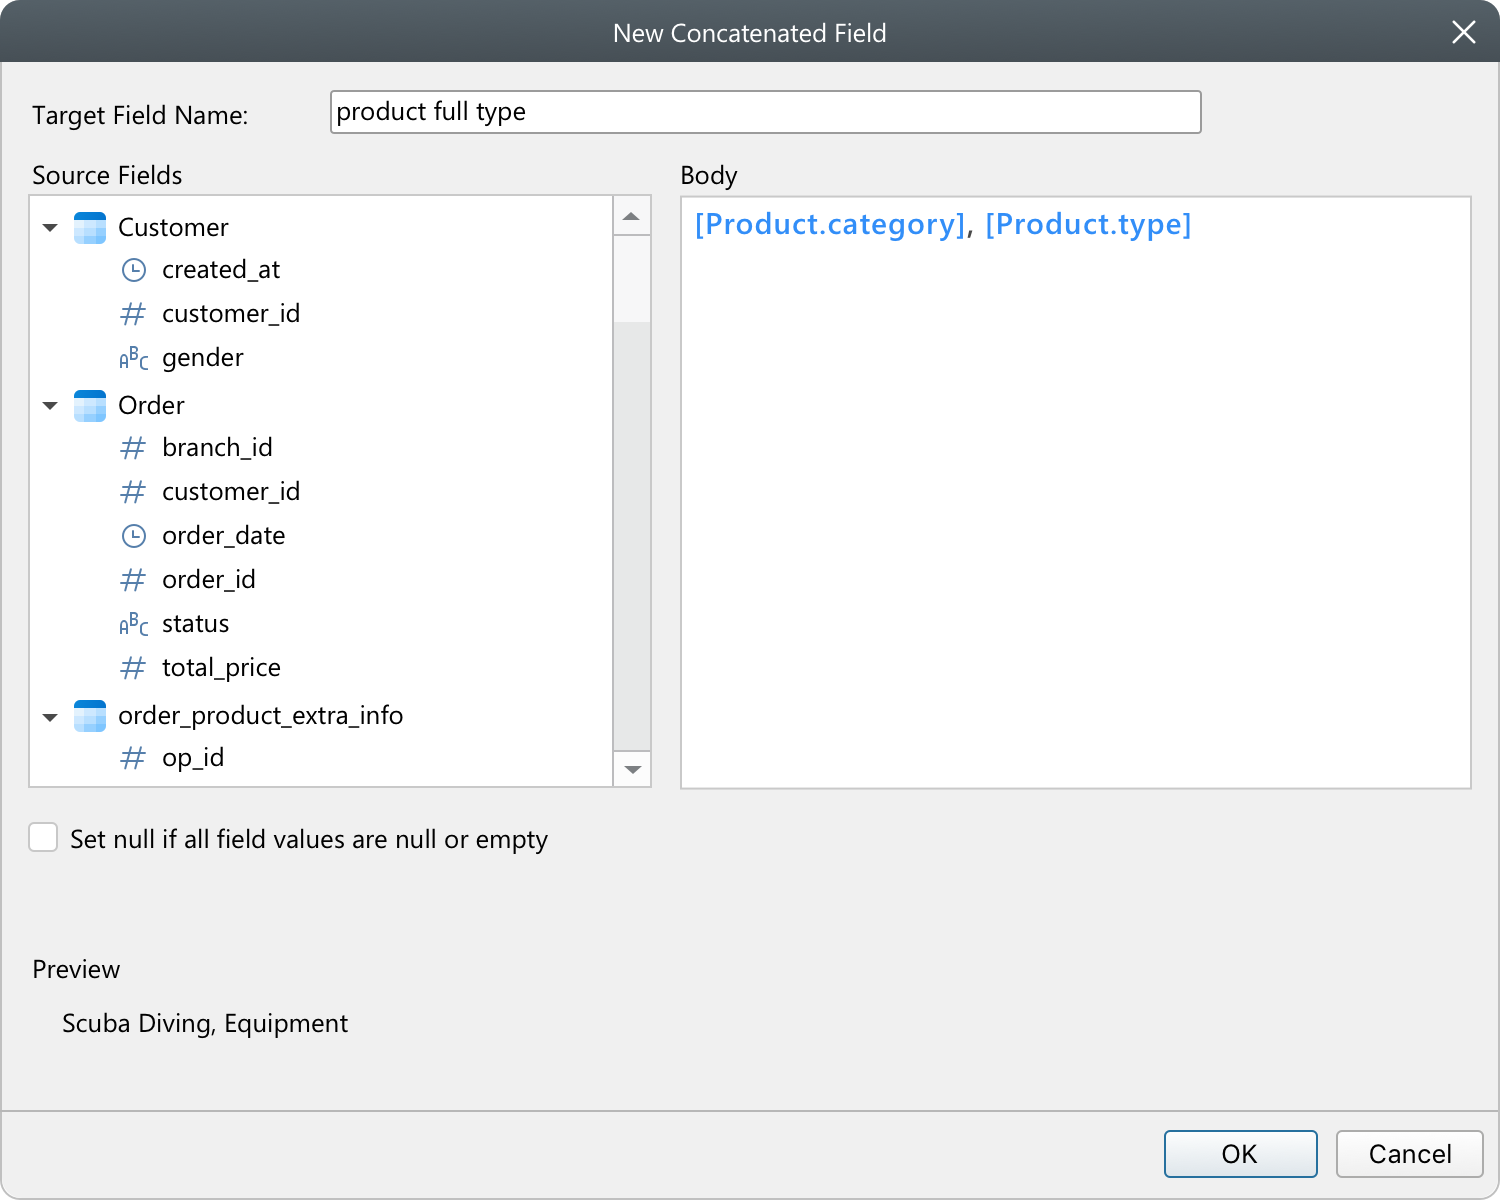
Merge the contents of different fields together to create a new field that can be used in your charts.
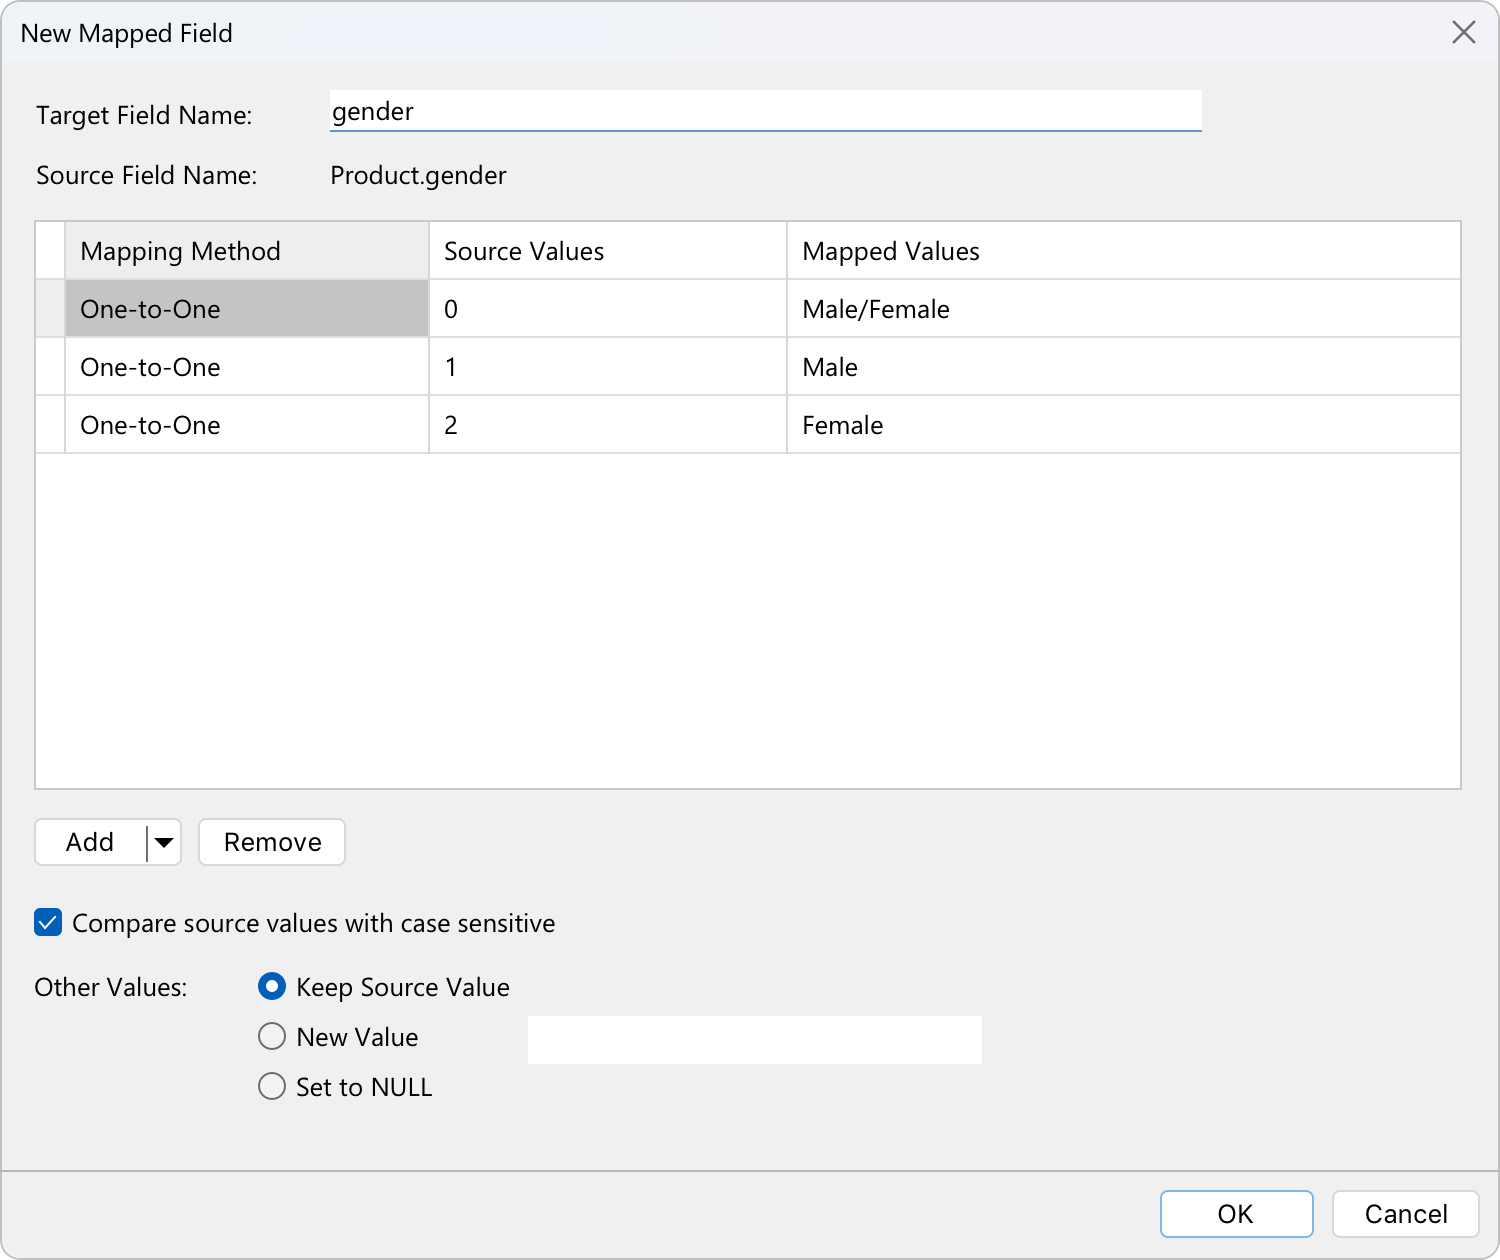
Create a new field populated with the results of applying a mapping rule on every value in the source field.
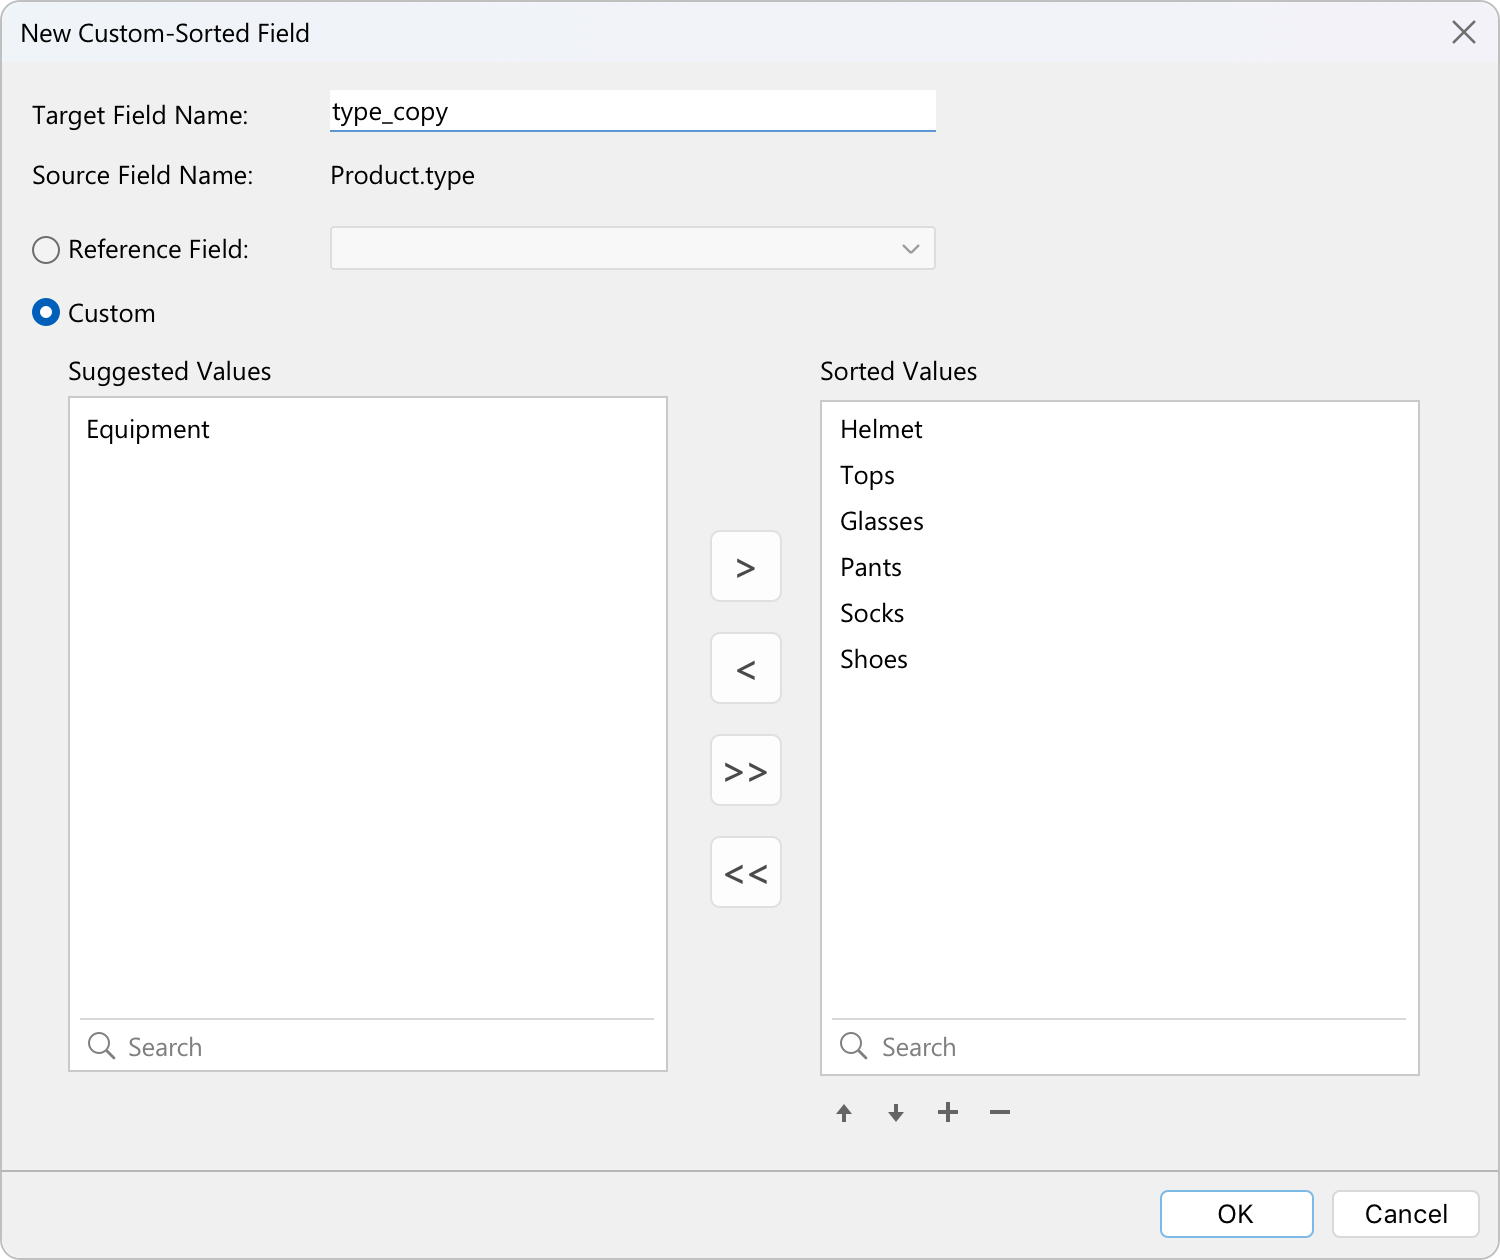
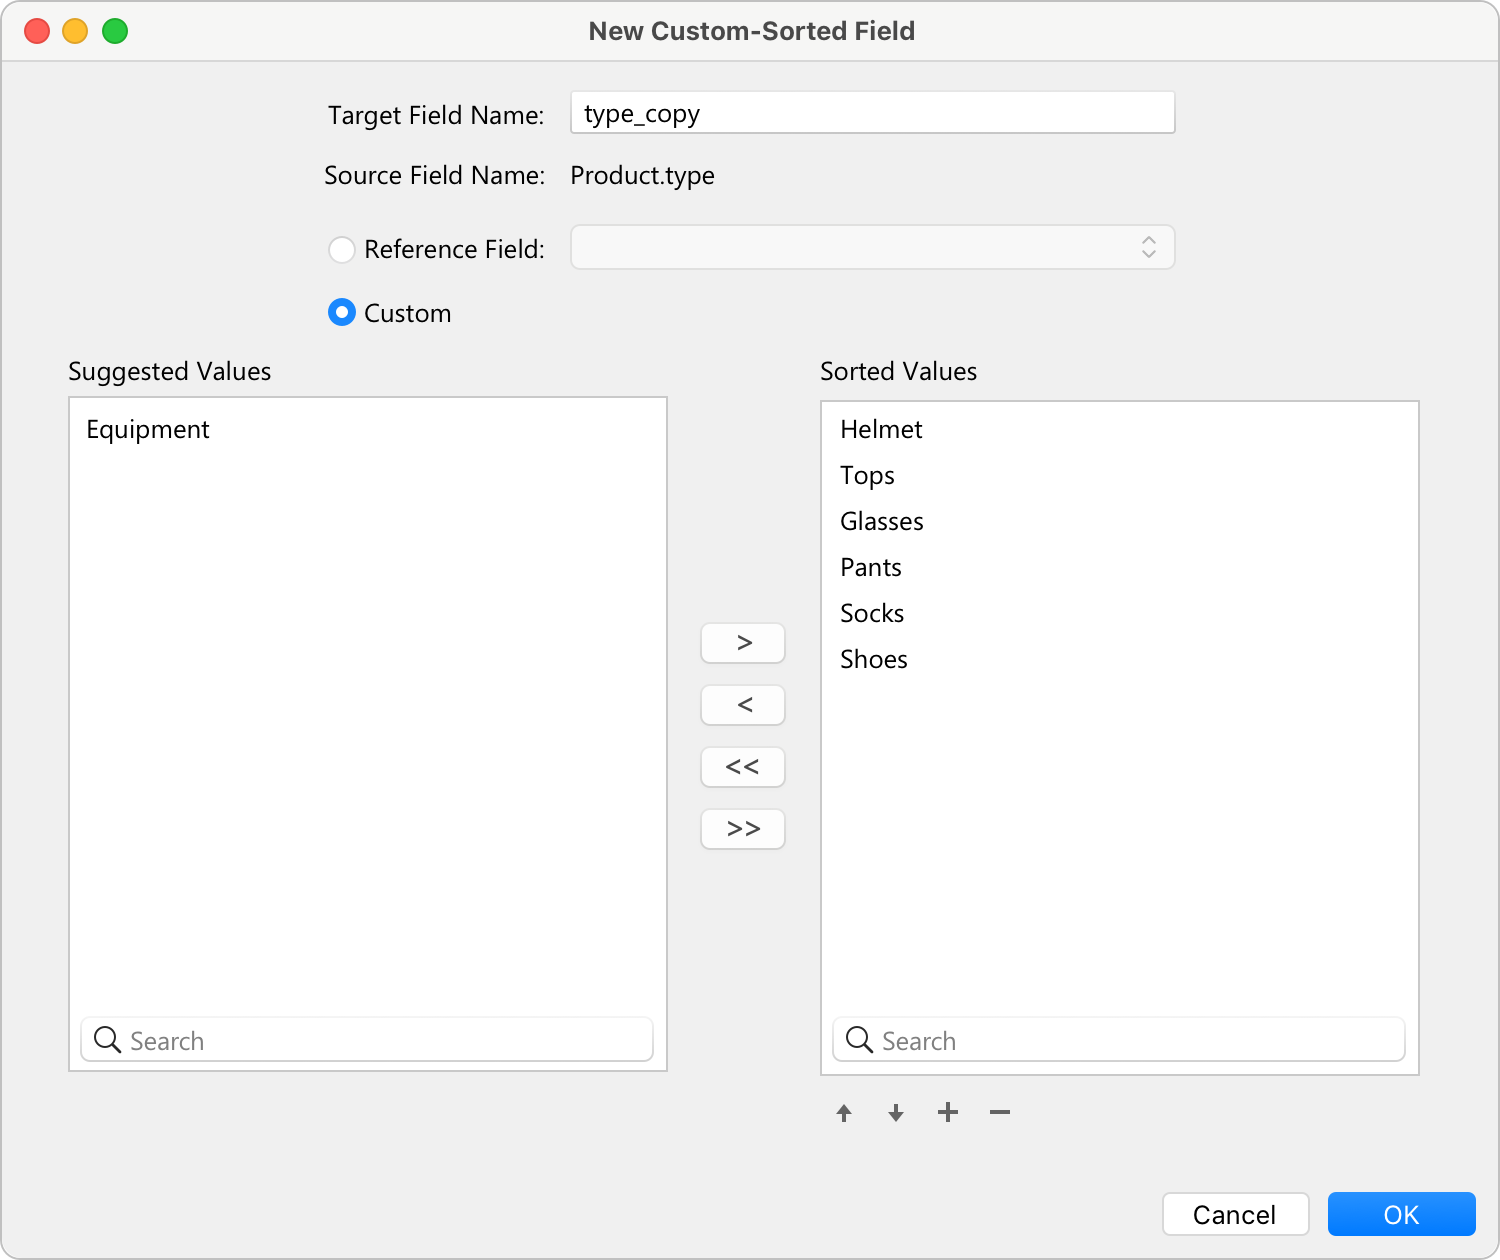
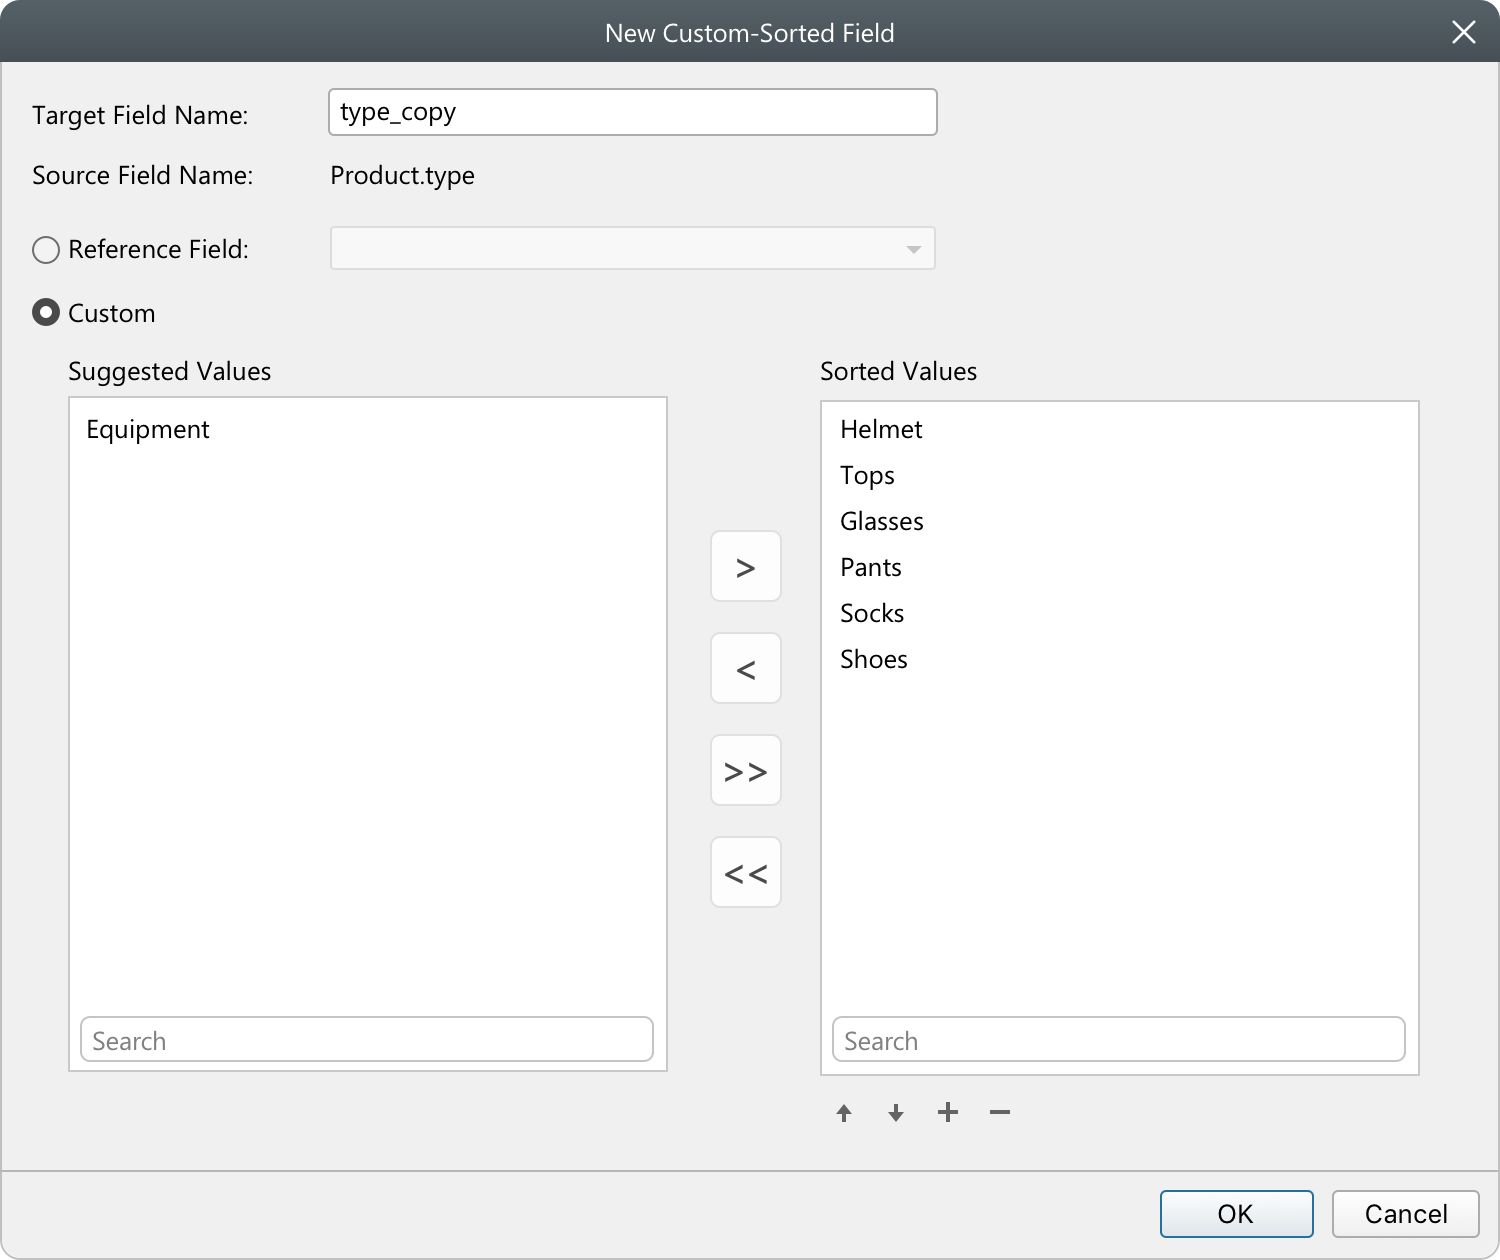
Rearrange the order of the values based on another field or a custom order. When you sort this new field in the chart, it will be sorted in the order you set.
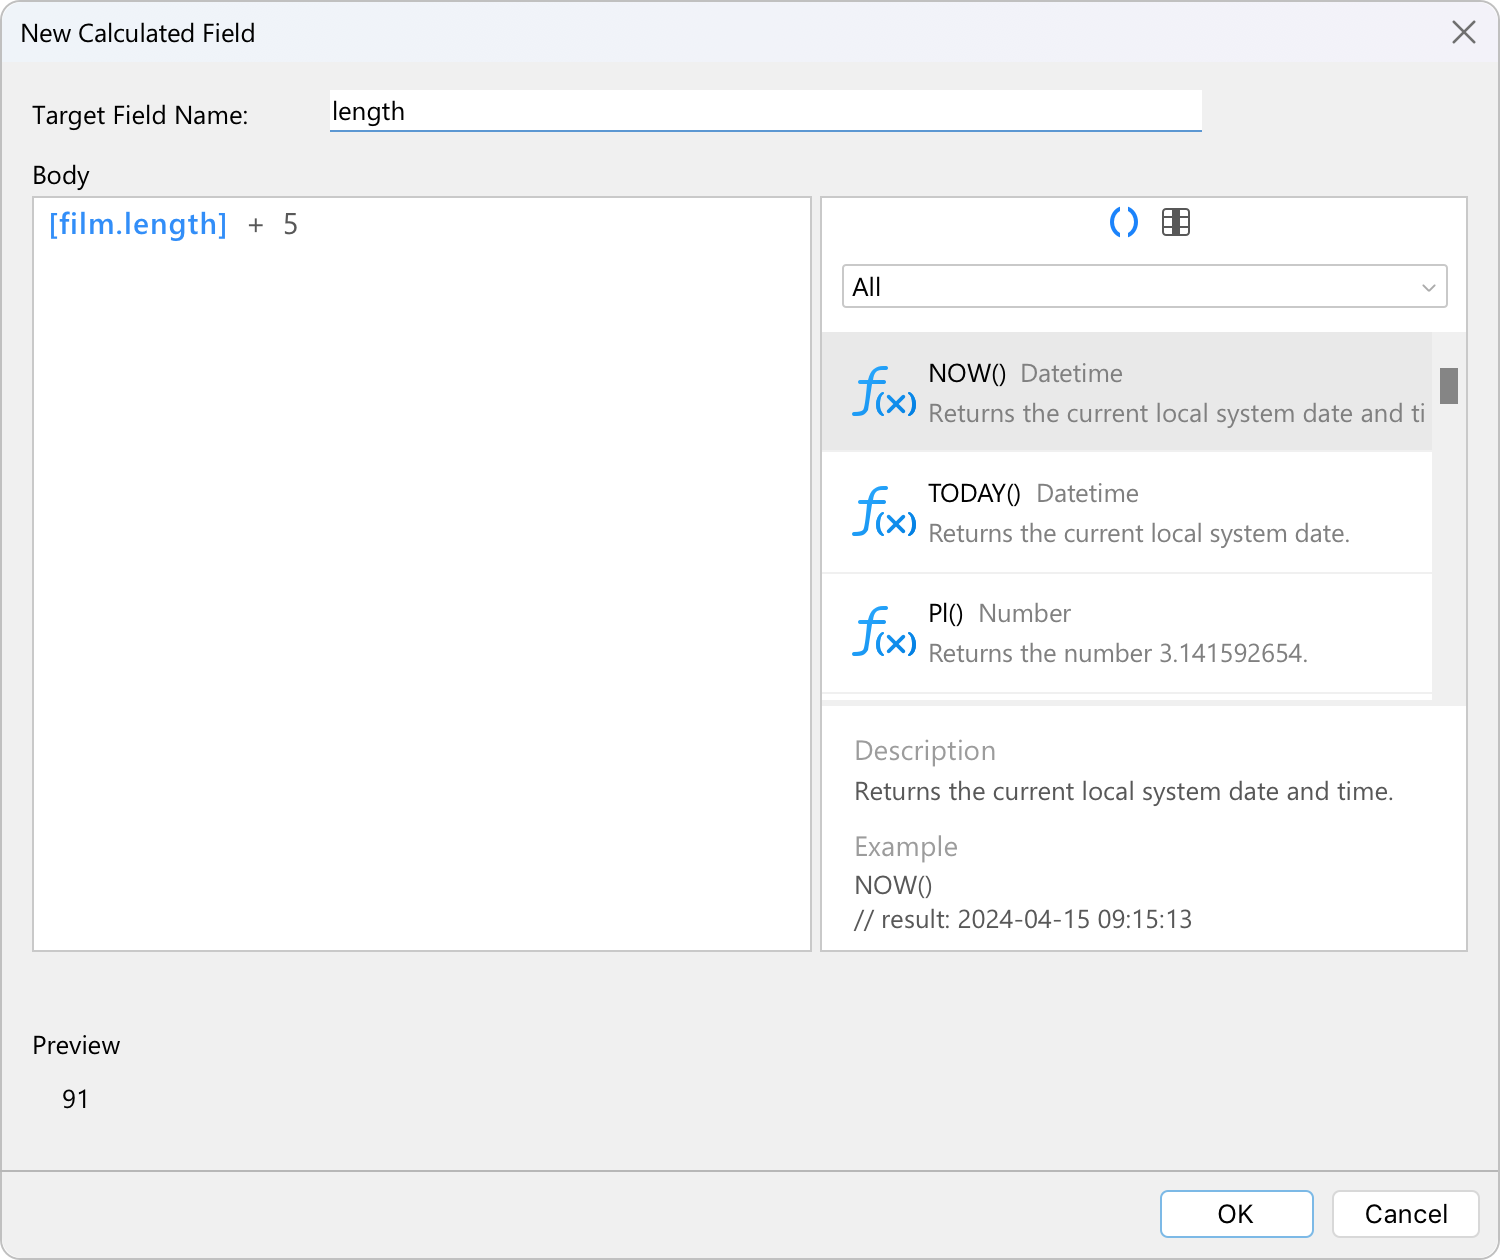
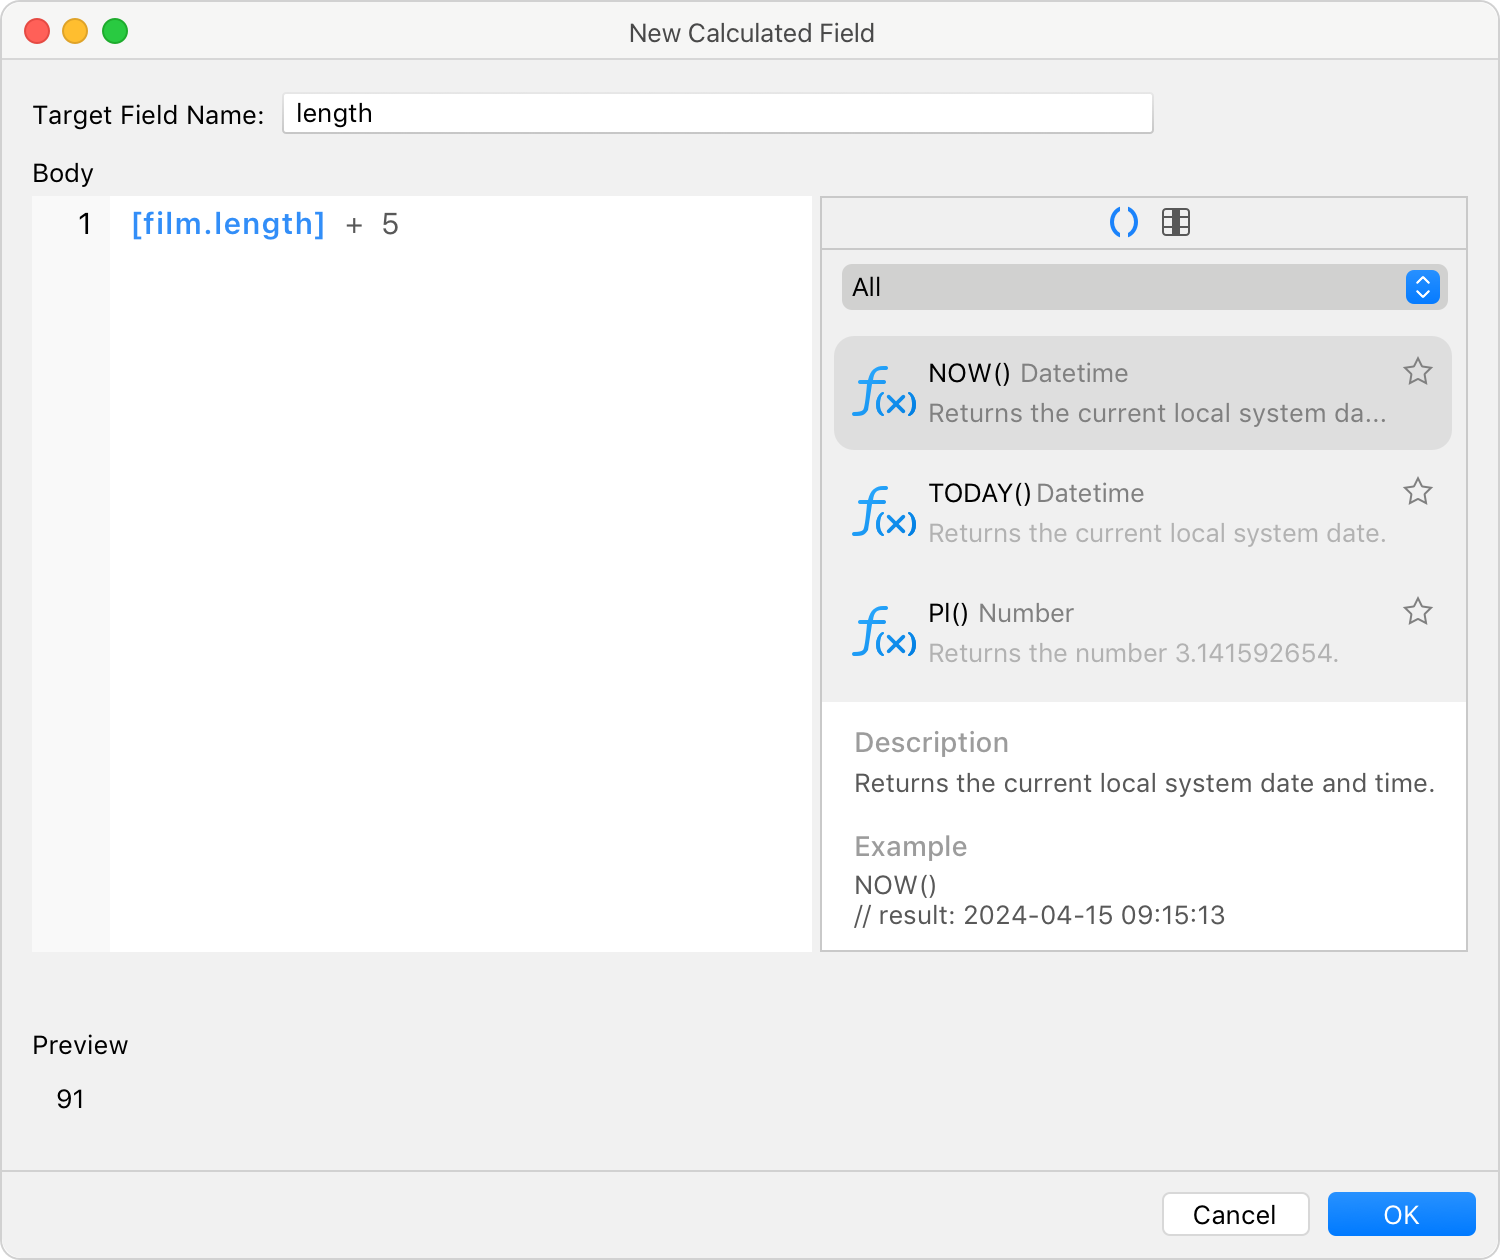
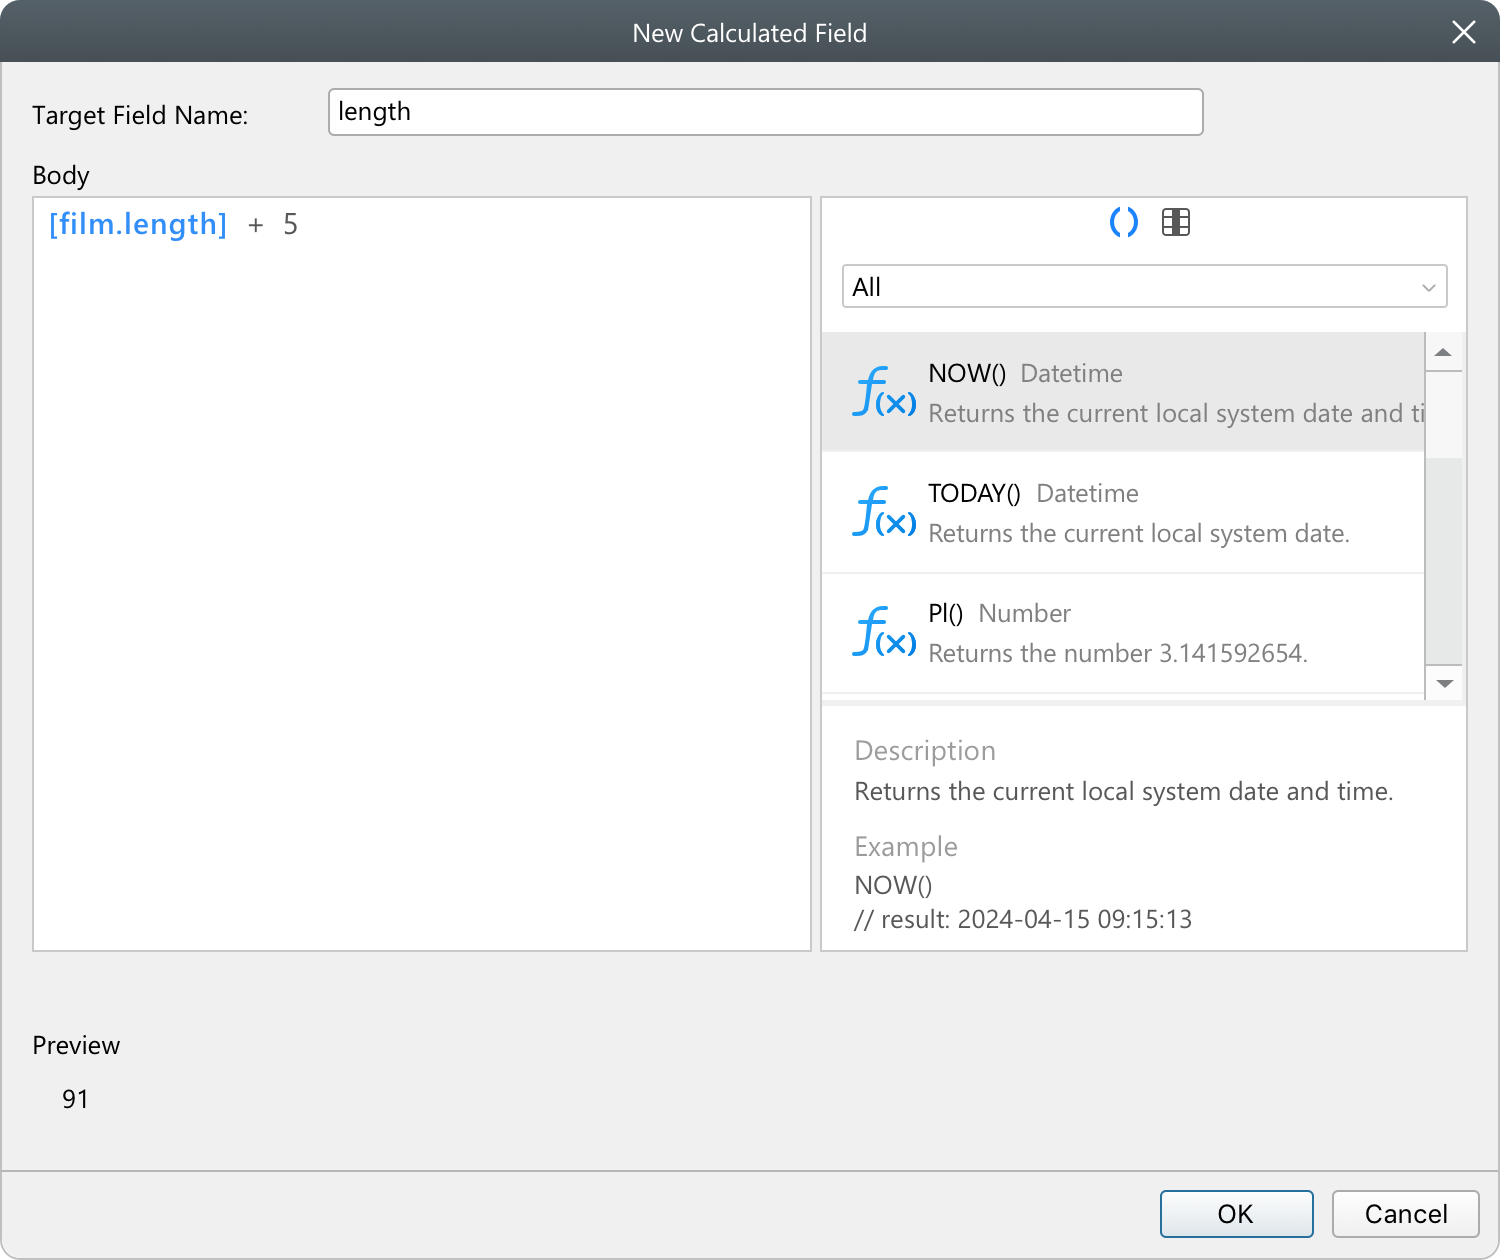
Apply combination of functions, fields and operators within the custom expression to perform advanced calculations without the burden of manual data manipulation.


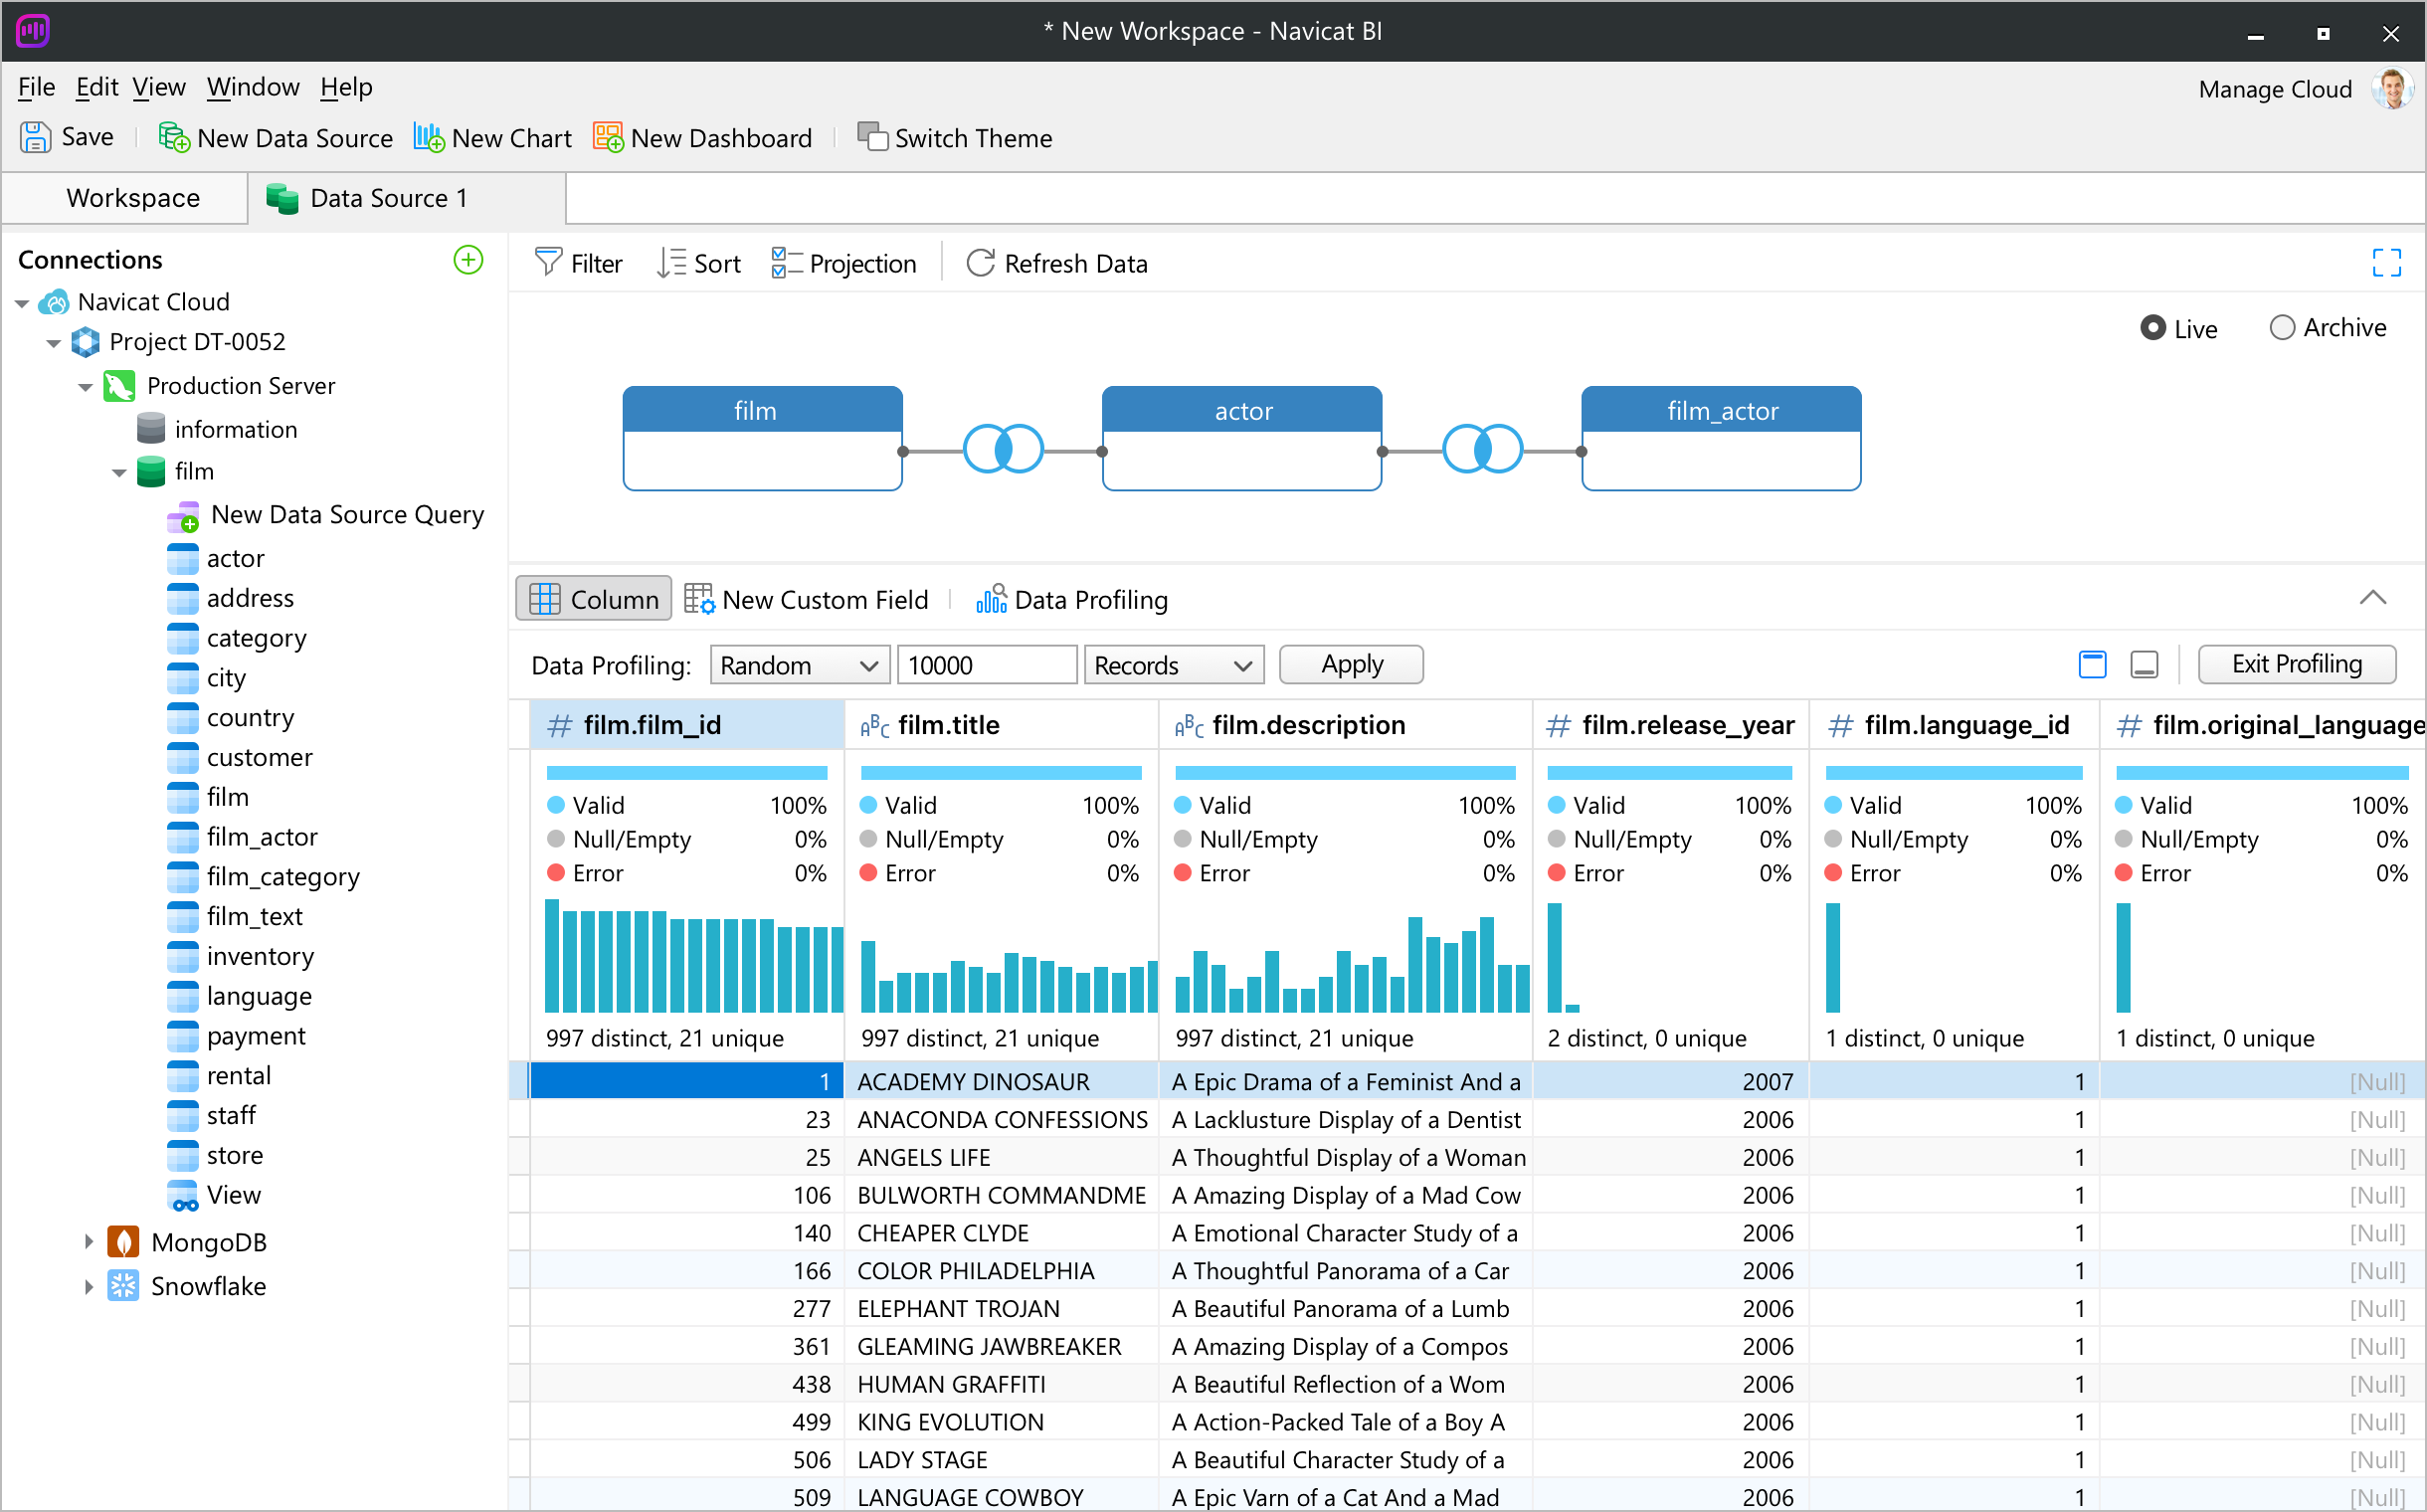
Convert the data type of a field to ensure accurate representation and appropriate analysis in a chart.
Merge the contents of different fields together to create a new field that can be used in your charts.
Create a new field populated with the results of applying a mapping rule on every value in the source field.
Rearrange the order of the values based on another field or a custom order. When you sort this new field in the chart, it will be sorted in the order you set.
Apply combination of functions, fields and operators within the custom expression to perform advanced calculations without the burden of manual data manipulation.

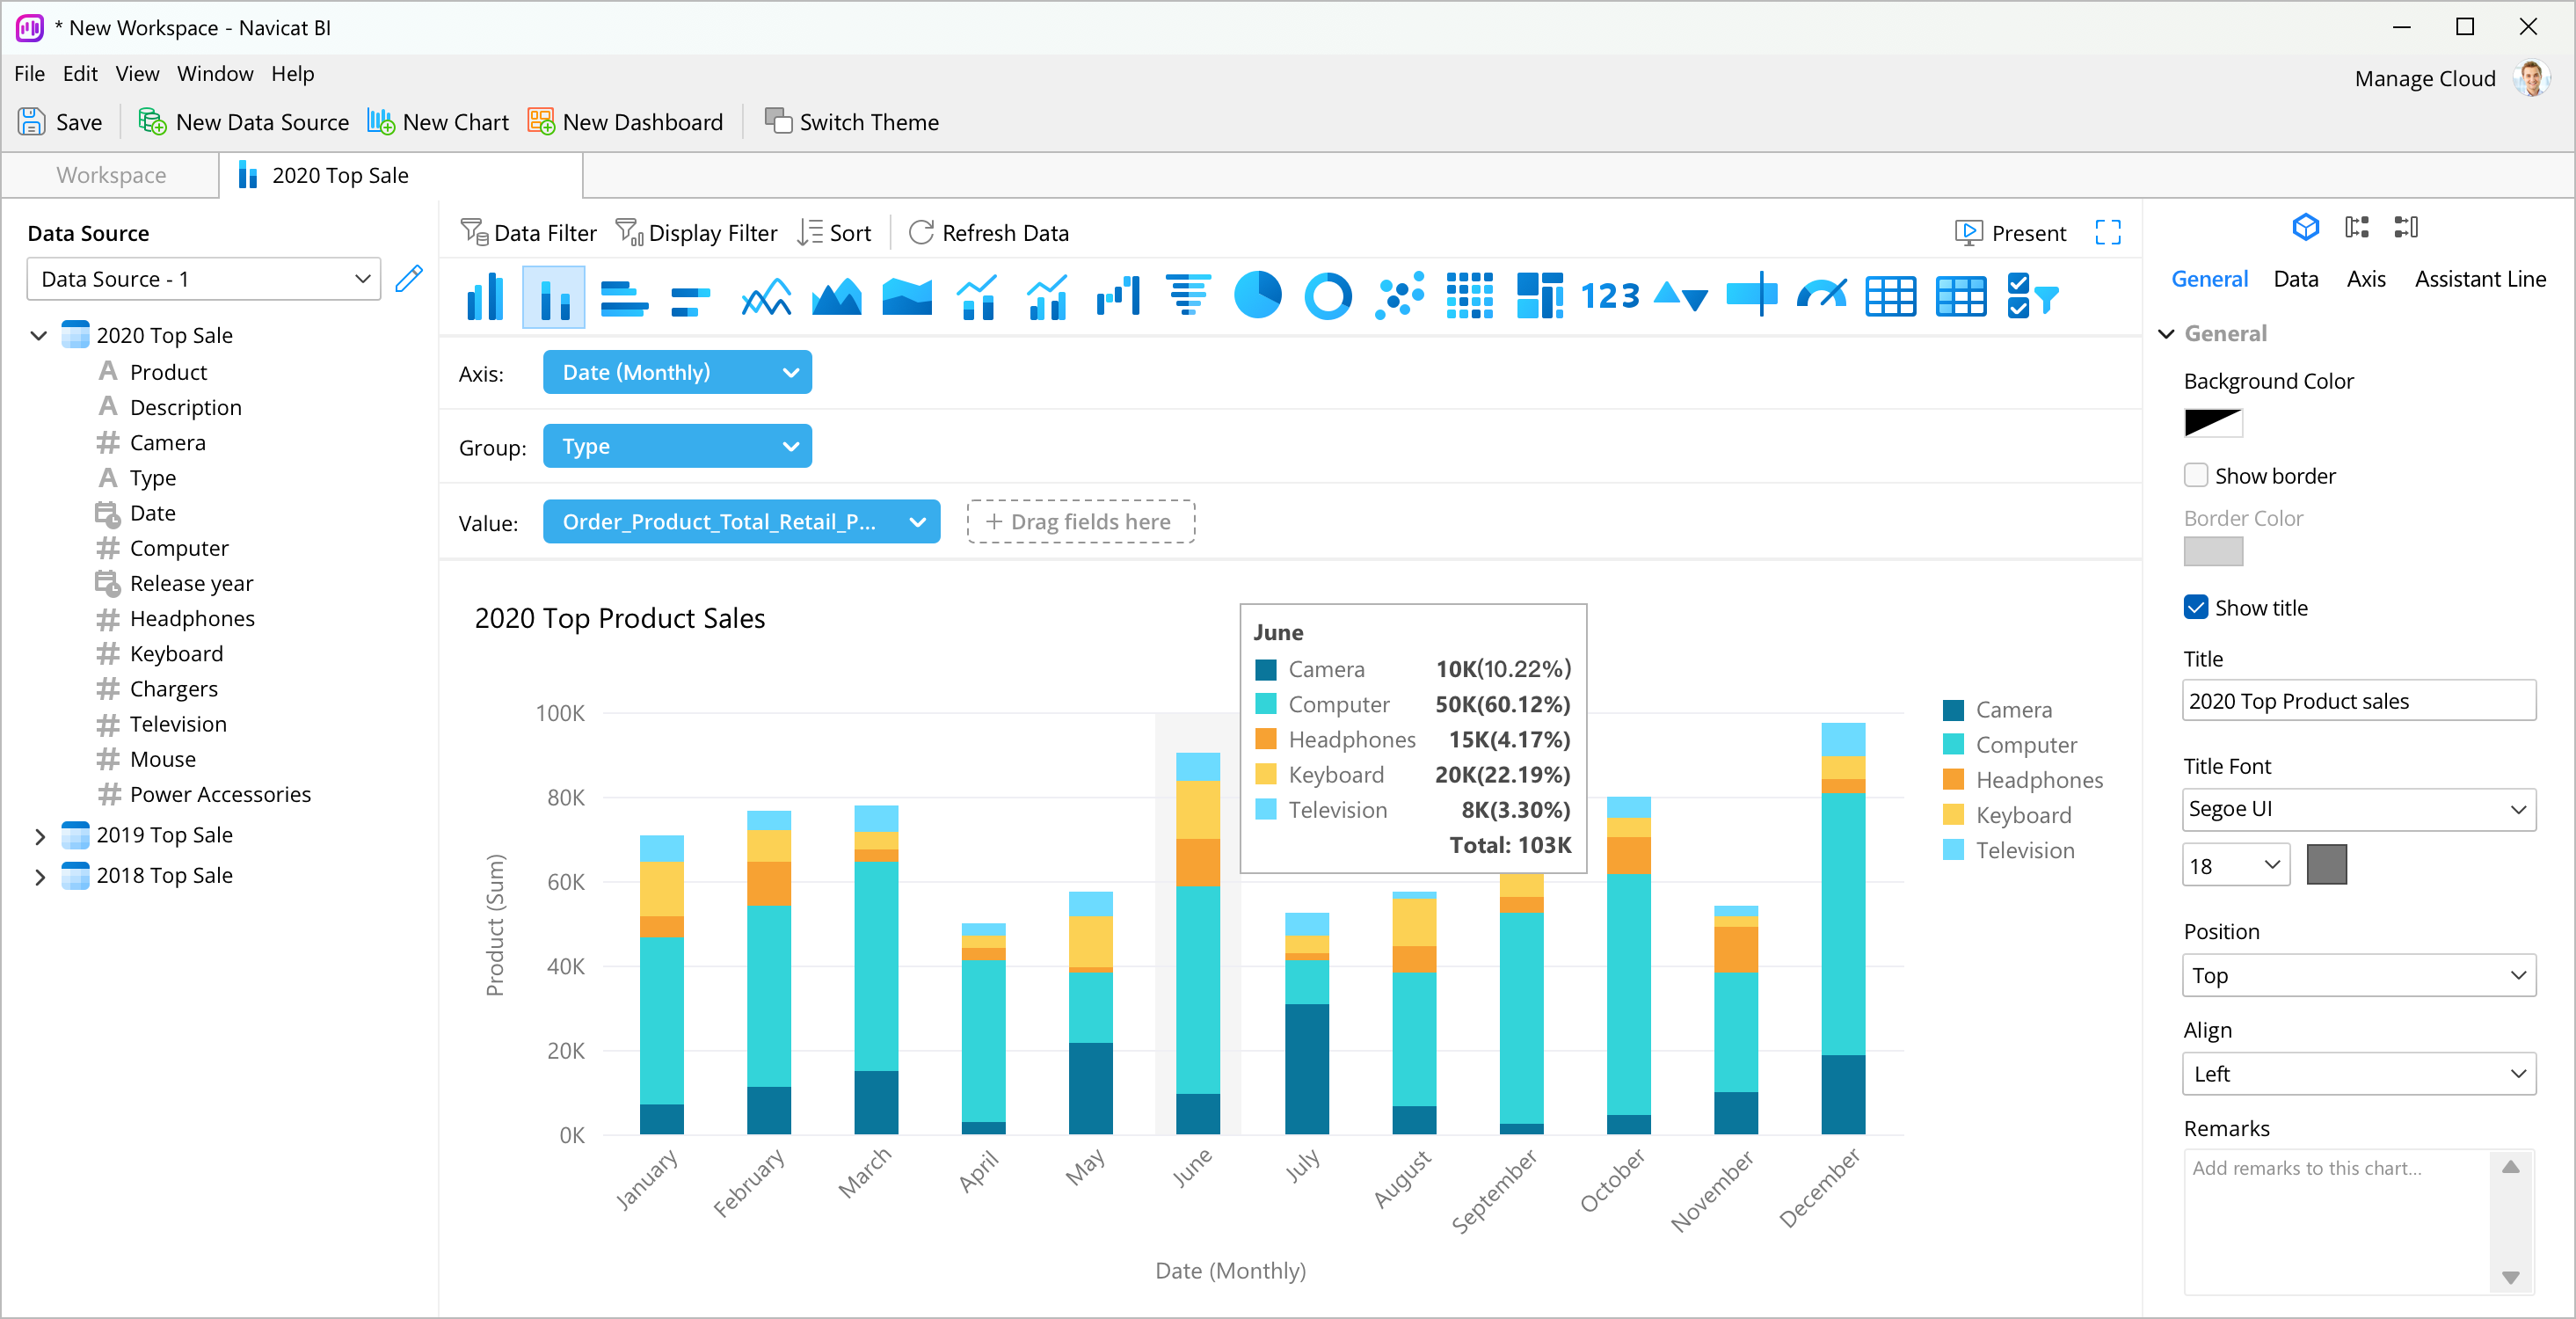


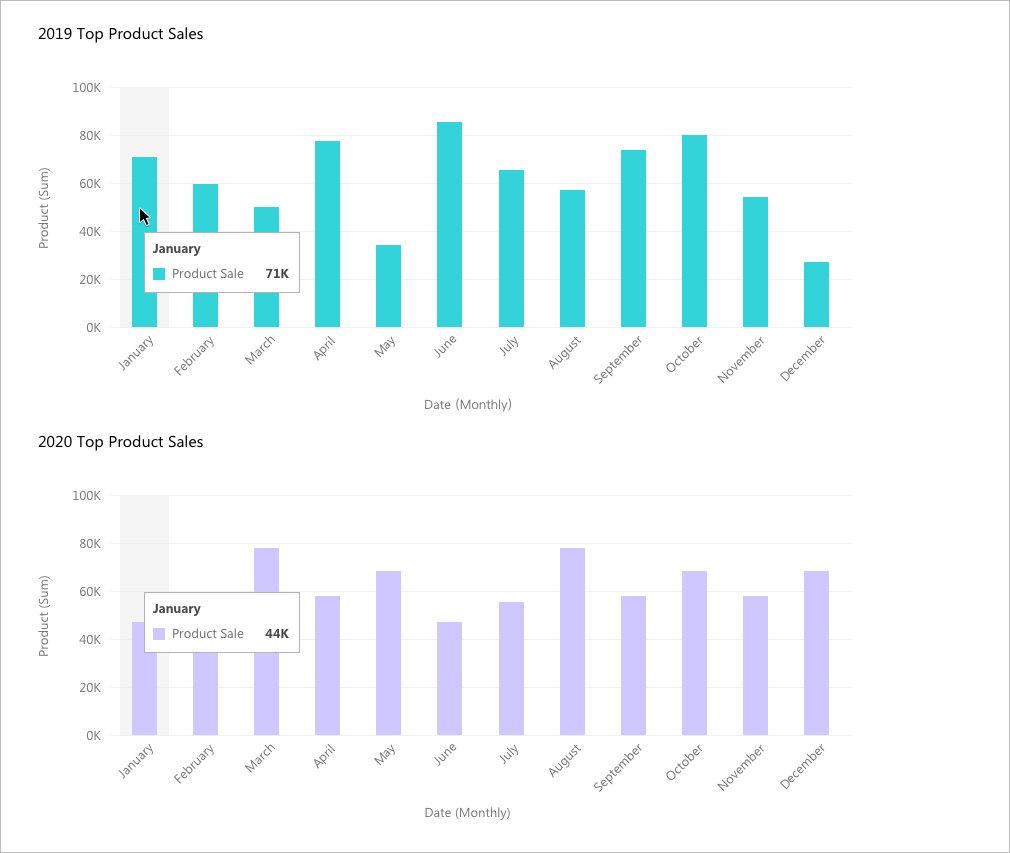


Elevate your clarity with focus mode.
Provide a distraction-free environment for you to focus on your charts design. You can maximize the workspace and focus on the specific task without getting sidetracked by extraneous information.

Create Charts Seamlessly with Navicat Native Design.
Navicat is natively designed specifically for a particular platform. We give you a more familiar and optimized experience that feels natural for the system you are running. Navicat delivers more stable and enjoyable experiences for your database management.


Flatpak supported distributions.
Debian 10, Debian 11, Debian 12, Ubuntu 20.04, Ubuntu 22.04, Ubuntu 24.04, Fedora 42, Linux Mint 20, Linux Mint 21, Linux Mint 22, Deepin 20, Deepin 23, Deepin 25, KylinOS Desktop 10, Pop!_OS 20.04, Pop!_OS 22.04
Debian 11, Debian 12, Ubuntu 22.04, Ubuntu 24.04, Fedora 42, Linux Mint 20, Linux Mint 21, Linux Mint 22, Deepin 23, Deepin 25, KylinOS Desktop 10, Pop!_OS 20.04, Pop!_OS 22.04