

Navicat Monitor 3 comes packed with a variety of exciting new features. Case in point, you can now create traces that collect query data based on selected filters from the server log. When creating a trace, you can define criteria to filter the data collected by SQL Profiler and set a schedule for executing the trace. In today's blog we'll learn how to create a trace and view its results.
More about Traces
The Tracing feature is part of the SQL Profiler, which is only available for PostgreSQL. The SQL Profiler provides graphical query execution details for locating inefficient and slow queries.
The data collected from traces may be analyzed and used to troubleshoot performance issues. For example, you can see which queries are affecting performances in the production environment.
Creating a Trace
You can create new traces on the SQL Profiler, Query Analyzer, and Long Running Queries pages by clicking the Add Trace icon ![]() or + New Trace.
or + New Trace.
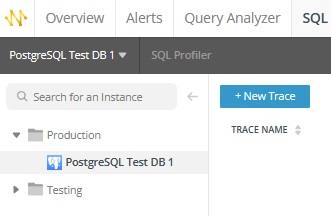
On the SQL Profiler page you'll have to select the instance before clicking the + New Trace button:
Clicking the Add Trace icon ![]() or + New Trace button will bring up the New Trace dialog. A prompt may pop up asking you to authorize Navicat Monitor to get relevant data from your instance.
or + New Trace button will bring up the New Trace dialog. A prompt may pop up asking you to authorize Navicat Monitor to get relevant data from your instance.
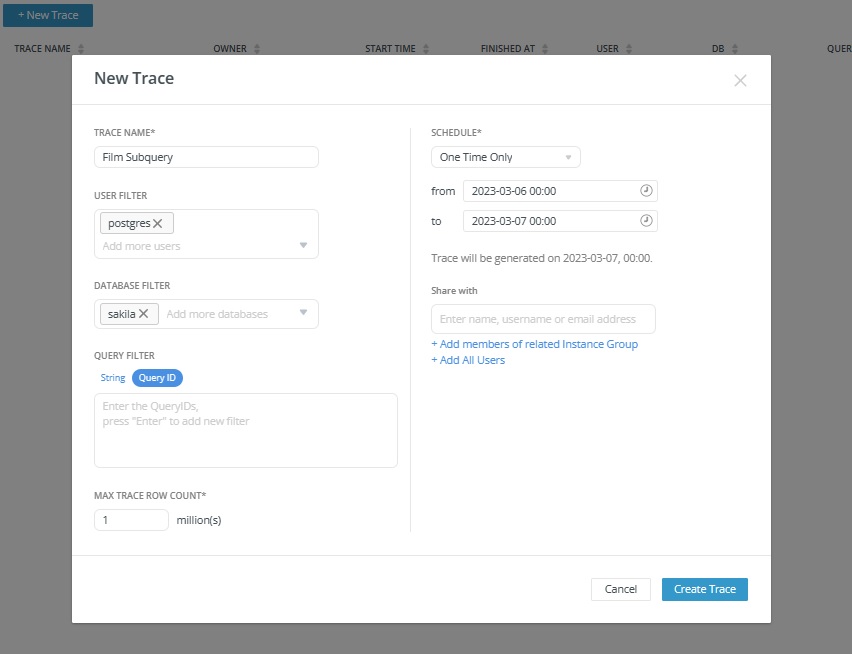
Here are all of the details that you can enter on the New Trace dialog:
- TRACE NAME: the name of the trace.
- USER FILTER: the users/roles whose queries to include in the trace. Empty means including queries from all users/roles.
- DATABASE FILTER: the databases to trace. Empty means including queries against all databases.
- QUERY FILTER: search strings or QueryIDs to filter queries for the trace.
- MAX TRACE ROW COUNT: the maximum number of rows for the trace. SQL Profiler will terminate the trace when it reaches the row count.
- SCHEDULE: scheduling details for executing the trace.
- Share with: who can see the trace.
Here's the New Trace dialog with some of the above fields filled in:
Clicking on Create Trace that starts tracing according to the provided schedule. You should then see results after the first time period has elapsed.
Viewing Trace Results
A trace provides a graphical representation of the execution plan for each query with statistics for its components. Here is the trace for a query against the Sakila Sample Database:
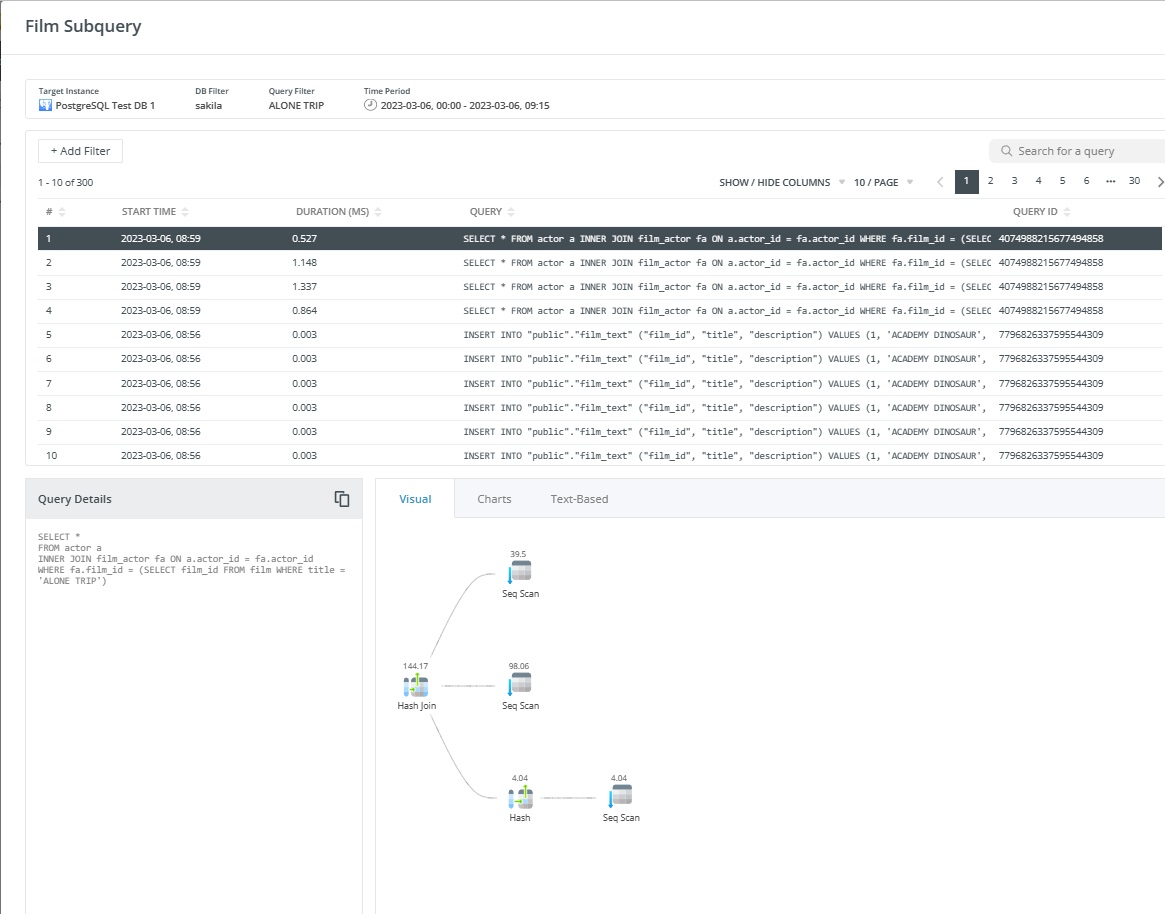
You can see from the above screen capture that the Trace Results are divided into 3 sections:
- Query Table: The query table shows the basic information for the queries. Select a query to show its details and plans.
- Query Details: shows the complete statement of the query.
- Execution Plan: the execution plan that is generated for each query can be viewed in three different formats: Visual, Charts and Text-Based.
Final Thoughts on Tracing Queries on your PostgreSQL Instances with Navicat Monitor 3
In today's blog we saw how easy it is to create a trace and view its results in Navicat Monitor 3. Only available for PostgreSQL, traces collect query data based on selected filters from the server log. I think that you'll find them to be indispensable for locating inefficient and slow queries.


