

Welcome to the 3rd installment in this series on Creating Custom Fields In Navicat BI. In Part 1, we learned how to add Type-Changed Fields to your Navicat BI charts. Part 2 went on to describe how to use Concatenated Fields. Today's blog will introduce Mapped Fields. We'll be modifying the data source that we used in the last two articles, which connects to the free "dvdrental" sample database and returns a list of rentals for each film category. In the next blog, we will use the updated data source to create a chart that compares new releases to other categories.
Field Mapping Overview
In many ways, field mapping is highly similar to the process of transformation in Information Technology (IT). Whereas the latter runs a value through an algorithm to arrive at a transformed value, field mapping is simply the changing of one or more column values to another.
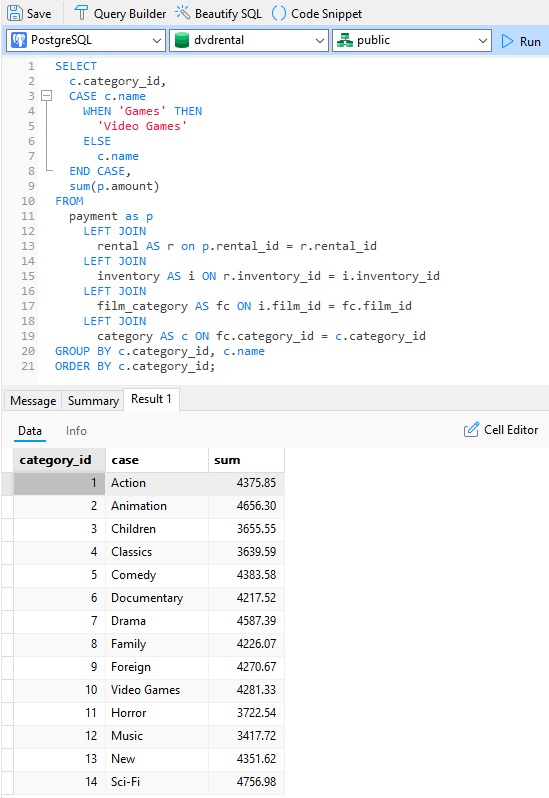
Field mapping can sometimes be observed in the field list clause of SELECT queries. For example, the "Sum of Payments per Movie Category" query which was the data source throughout this series returns a list of film categories along with a sum of their sales (or, more specifically, rentals). We can employ a CASE statement to make certain category names more descriptive, like say "Games" to "Video Games":
Creating the New Releases vs. Other Categories Data Source
Before designing any chart, we need a data source to fetch the information we require. Once you've got a few data sources, you might find it easier to repurpose an existing one rather than create a new data source from scratch. In fact, the Rentals by Category data source that we used last time will do nicely.
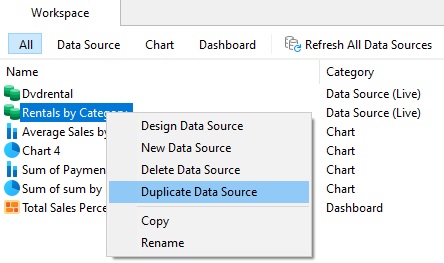
We can easily duplicate any item in the Navicat BI workspace by selecting and then right-clicking (or Control-click on macOS) it in the workspace, and selecting Duplicate <Item Type> from the context menu. Hence, the menu item that we would want is "Duplicate Data Source":
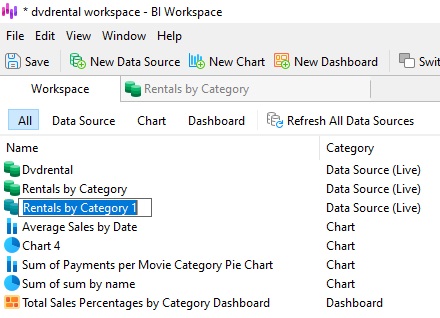
That will create a new data source named "Rentals by Category 1". To rename our new data source, click once on the item to select it and then a second time to activate edit mode. You can tell that the item is ready for editing when the label turns into a textbox with the item text highlighted in blue:
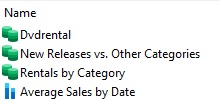
Let's call our new data source "New Releases vs. Other Categories". Press the Enter key to save the new name:
Adding a Mapped Field
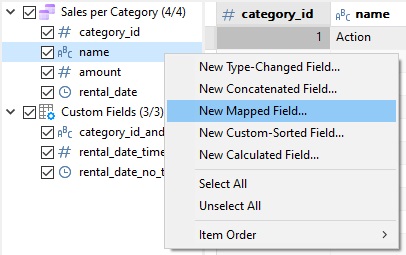
To add a new Mapped Field to the data source, right-click the name field (or Control-click on macOS) and select New Mapped Field... from the context menu:
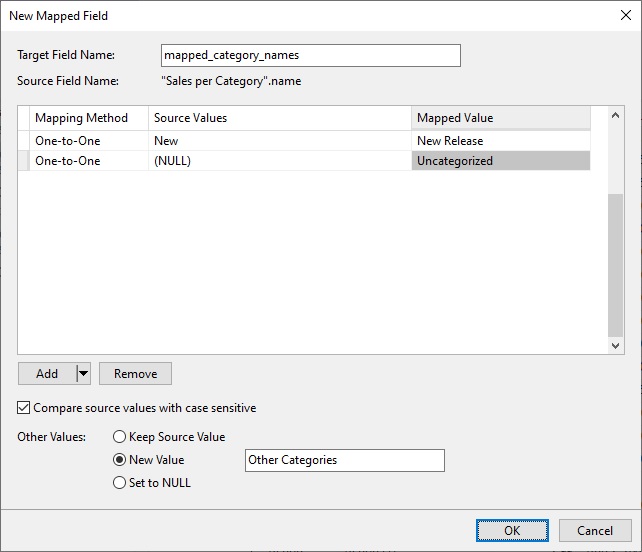
That opens the New Mapped Field dialog. There, let's begin by renaming the Target Field Name to "mapped_category_names".
Next, we'll map the "New" category name to something more descriptive. To do that:
- Since the "New" category will have a one-to-one mapping to the new value, select "One-to-One" from the Mapping Method drop-down.
- Choose "New" as the Source Value.
- Enter "New Release" for the Mapped Value.
Now we'll repeat the process for Null values, i.e., films which have not been assigned a category.
- Click the Add button and select "Add One-to-One Values..." from the context menu.
- In the Add One-to-One Values dialog, select the checkbox next to the (NULL) value and enter "Uncategorized" for the Mapped Value.
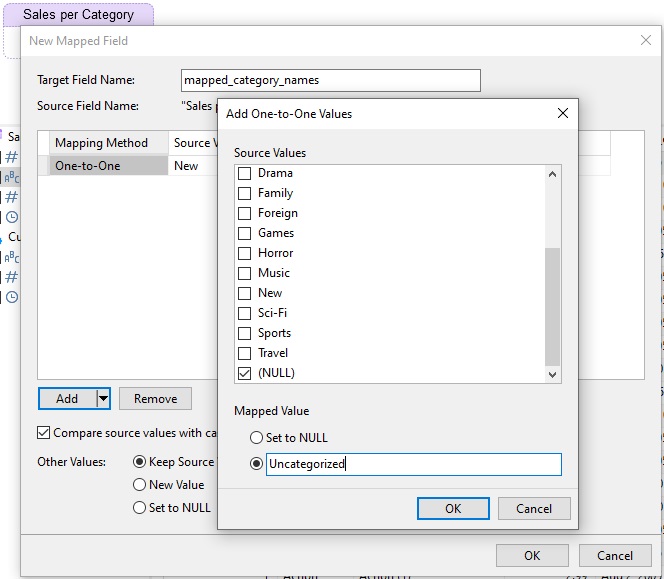
- Click the OK button to close the dialog and add the new row to the Mapped Fields table.
Finally, toggle the New Value radio button next to the Other Values label and enter "Other Categories" so that all other values are assigned to this catch-all category. The dialog should look as follows at this point:
Click OK to close the dialog. You should now see the mapped_category_names field in the data grid:
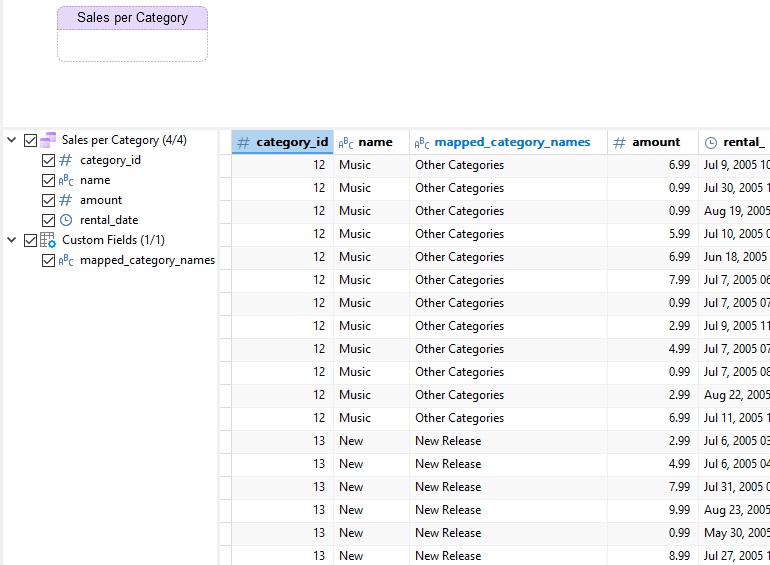
If you wish, you may delete the other calculated fields (as shown in the above image), since they won't be needed for the chart that we will be building next week.
Conclusion
This blog covered how to use Mapped Fields in your Navicat BI data sources. It is one of five custom field types, which include: Type-Changed, Concatenated, Mapped, Custom-Sorted, and, Calculated. Next week, we will use the "New Releases vs. Other Categories" data source to create a chart that compares new releases to other categories.
You can download Navicat BI for a 14-day fully functional FREE trial. It's available for Windows, macOS, and Linux operating systems.


