

Welcome to part 2 in the Creating Custom Fields In Navicat BI series. Part 1 laid the groundwork for adding custom fields to your Navicat BI charts, starting with Type-Changed Fields. Today's blog will continue with Concatenated Fields. As with the last article, we'll be using a data source that connects to the free "dvdrental" sample database.
What Is Concatenation?
Concatenation is the appending of one string to another. It's commonly employed in queries to combine first and last name fields together. Case in point, the actor table in the "dvdrental" sample database splits actors' names into first_name and last_name fields. We can include both in a single column of the result by utilizing the concat() function:
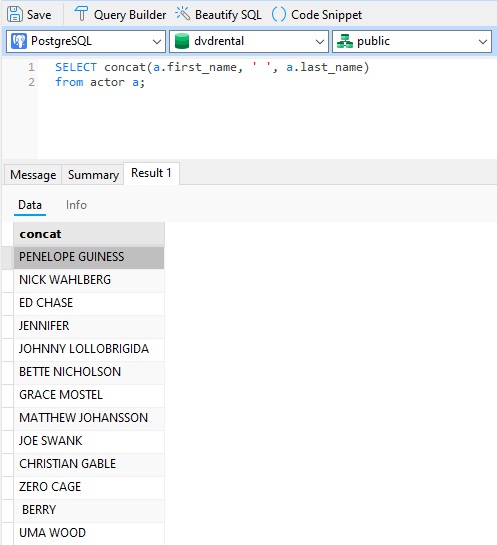
Notice the passing of the space delimiter as the second input parameter; without it the names would be combined into a single word.
Adding a Concatenated Field To the Rentals by Category Data Source
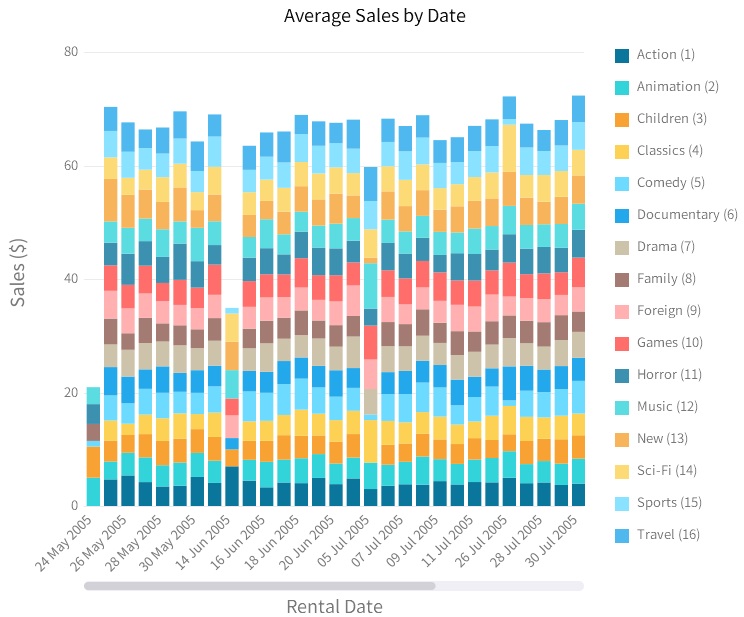
In the recent blog on Type-Changed Fields we created a Vertical Stacked Bar Chart that shows daily sales for each movie category:
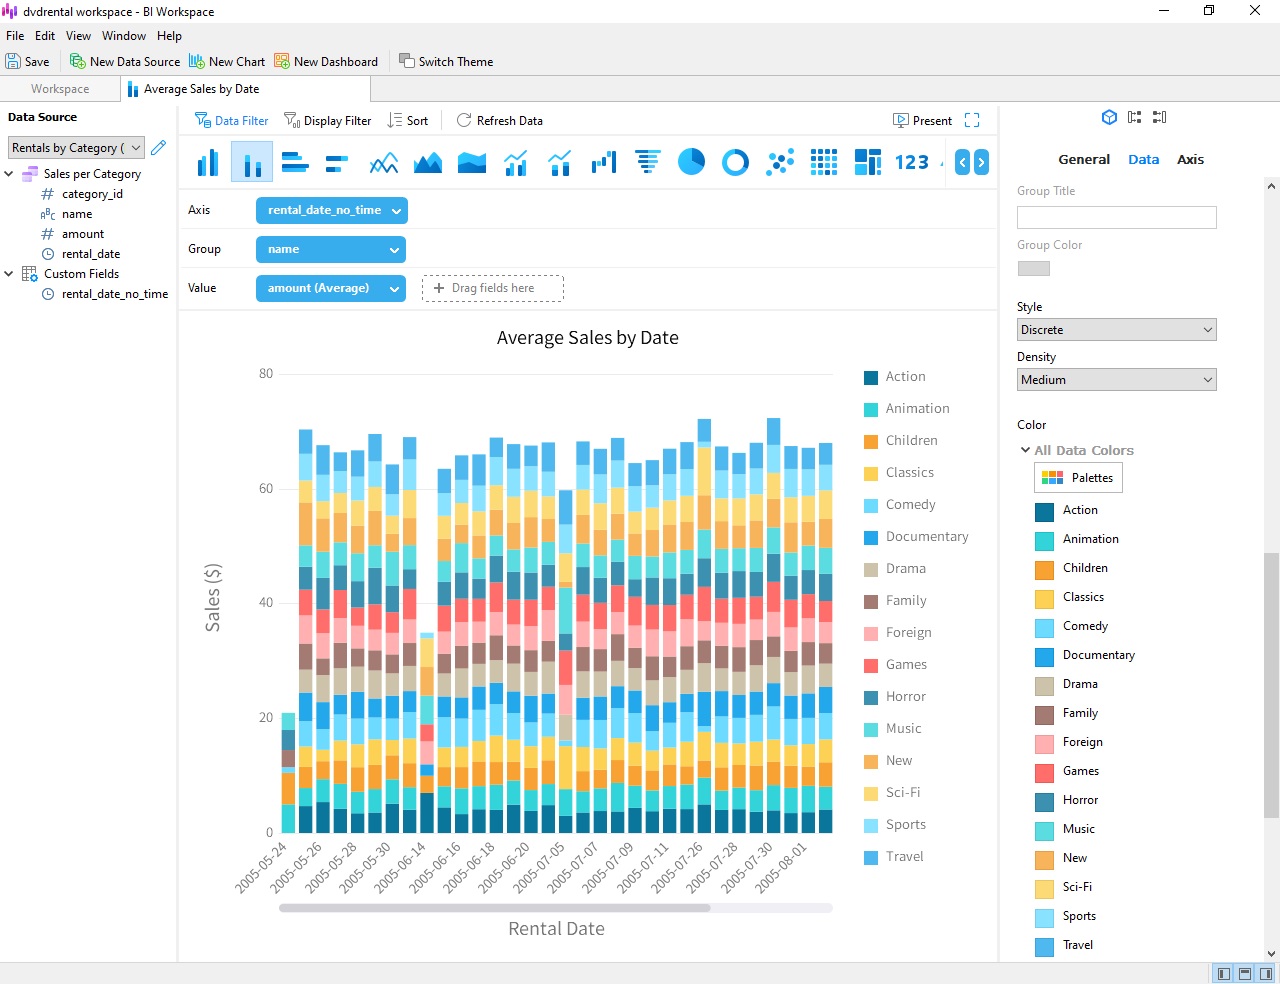
We'll now modify that chart so that categories include IDs, so that "Comedy" will now appear as "Comedy (5)".
To do that, we'll have to modify the "Rentals by Category" data source, which supplies the data that populates the chart.
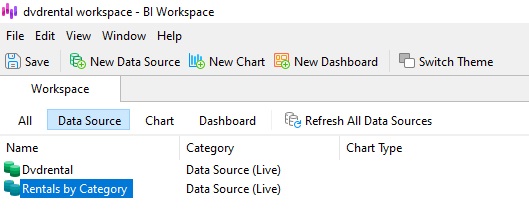
Locate and double-click the "Rentals by Category" data source in the BI workspace (Hint: if you have a lot of items in your workspace, you can click on the "Data Source" toggle button to only show data sources):
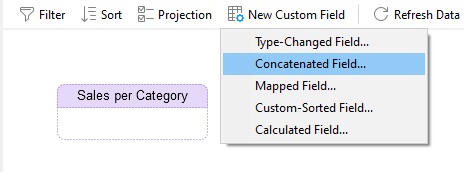
To add a new Concatenated Field to the data source, select New Custom Field -> Concatenated Field... from the menu:
That opens the New Concatenated Field dialog. We can see that Navicat already included the category_id in the Body textarea. Place it within parentheses "()" and add the name field in front of it so that the contents of the Body field are:
["Sales per Category".name] (["Sales per Category".category_id])
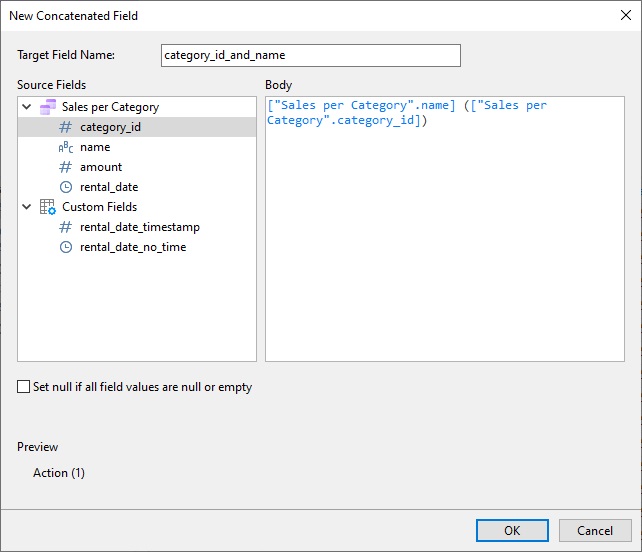
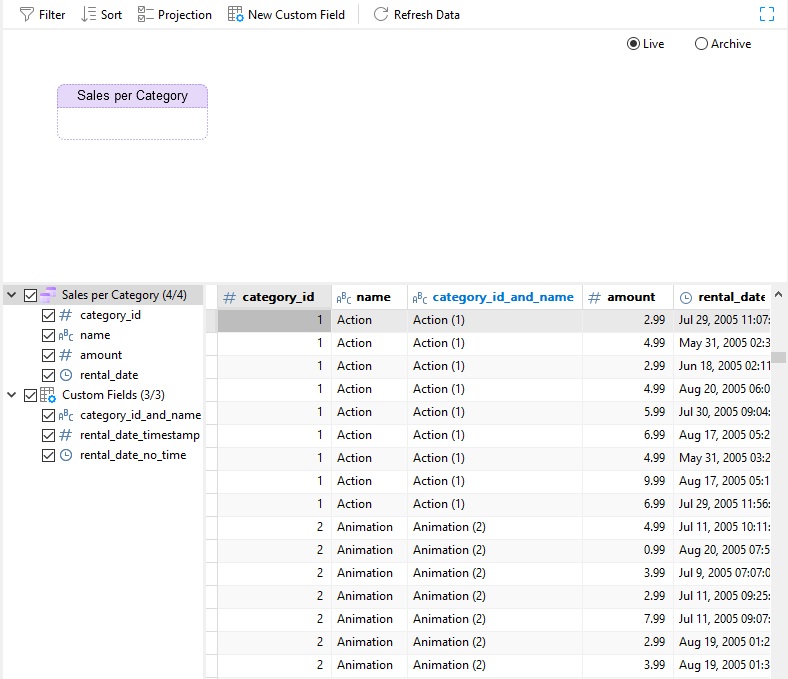
In the Target Field Name, enter "category_id_and_name" and click OK to create the new field. Our new field will appear in the data grid with a blue header:
Updating Categories In the Average Sales by Date Chart
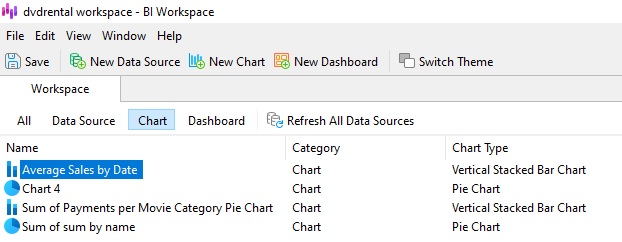
Now all that's left to do is replace the "name" field in the "Average Sales by Date" chart with our new Concatenated Field. To do that, you'll first need to open the chart by locating and double-clicking it in the BI workspace (Hint: if you have a lot of items in your workspace, you can click on the "Chart" toggle button to only show charts):
Next, we can simply drag-and-drop the "category_id_and_name" field from the data source field list to the chart Group:
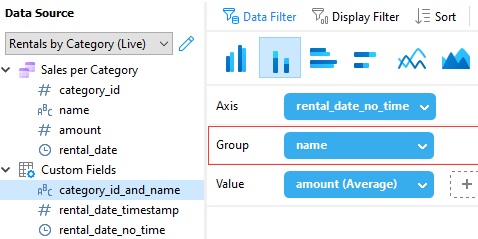
That will instantly cause the chart to refresh. Notice that the legend values now include IDs:
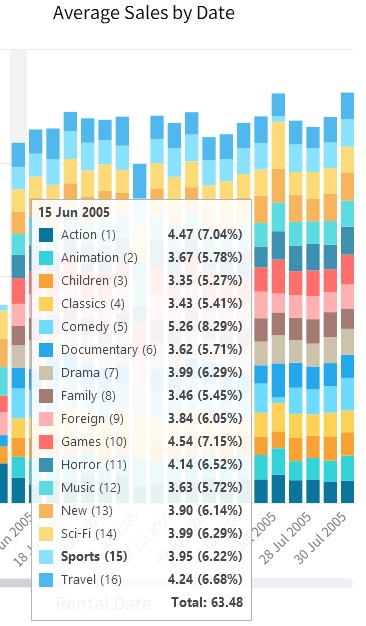
Hovering the cursor over a vertical bar in the chart shows all of the data for that day, with the category under the cursor in bold:
Conclusion
This blog covered how to use Concatenated Fields in your Navicat BI data sources and charts. It is one of five custom field types, which include: Type-Changed, Concatenated, Mapped, Custom-Sorted, and, Calculated. Next week, we'll learn more about mapped fields.
You can download Navicat BI for a 14-day fully functional FREE trial. It's available for Windows, macOS, and Linux operating systems.


