

Usually, when your database runs slower for an extended period, the culprit is more often than not a "bad" query. That is to say, a query that is not fully optimized, poorly written, or gives users the ability to fetch an unlimited number of rows from the database. We can alleviate some pain by throwing more resources at the server, but this is really a short term fix and doe not address the underlying issue. The best course of action is to identify and fix the problem query or queries, which shouldn't be too difficult, given some time and effort. Of course, the first step is to identify which query or queries is/are the stalwarts. There are a few ways to do that, depending on your specific database type. Today's blog will highlight a few strategies for MySQL.
Using the MySQL PROCESSLIST Table
The PROCESSLIST Table is one of many metadata tables within the INFORMATION_SCHEMA database. As the name suggests, it maintains information for all processes running within a database instance. There are several ways to access it, as shown in the next several sections.
Using the mysqladmin Command Line Tool
The mysqladmin command line tool ships with MySQL. Run it with the flag "processlist" (or "proc" for short) to see currently running processes. Moreover, adding the "statistics" flag (or "stat" for short) will show running statistics for queries since MySQL's last restart:
Here is some sample output:
+-------+------+-----------+-----------+---------+------+-------+--------------------+----------+
| Id    | User | Host      | db        | Command | Time | State | Info               | Progress |
+-------+------+-----------+-----------+---------+------+-------+--------------------+----------+
| 77255 | root | localhost | employees | Query   | 150  |       | call While_Loop2() | 0.000    |
| 77285 | root | localhost |           | Query   | 0    | init  | show processlist   | 0.000    |
+-------+------+-----------+-----------+---------+------+-------+--------------------+----------+
Uptime: 781398  Threads: 2  Questions: 18761833  Slow queries: 0  Opens: 2976  Flush tables: 1  Open tables: 101  Queries per second avg: 26.543
Since this command runs on the shell interface, you can pipe output to other scripts and tools. The downside is that the PROCESSLIST table's info column is always truncated so it does not provide the full query on longer queries.
Querying the MySQL PROCESSLIST Table
One way to query the PROCESSLIST table is to run the "show processlist;" query from within MySQL's interactive mode prompt. Navicat users can execute the show processlist query directly within the SQL Editor just like any query:
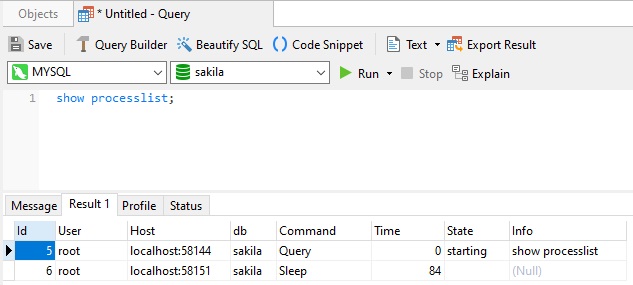
Note that adding the "full" modifier to the command is sometimes required in order to disable truncation of the Info column. (This is necessary when viewing long queries.)
Using a Monitoring Tool
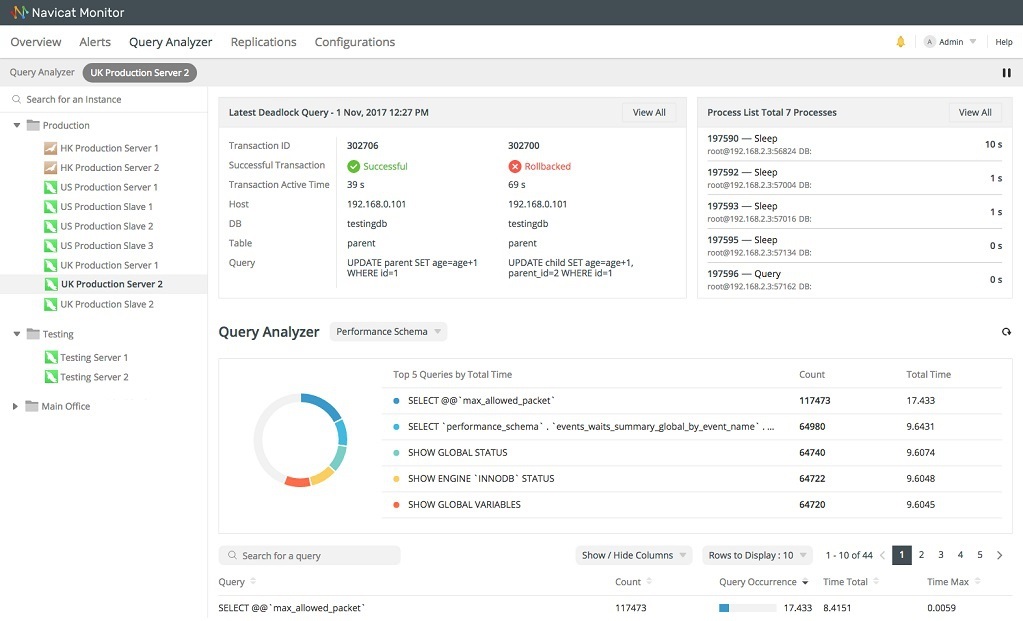
For more in-depth analysis of query performance, many professional database administrators (DBAs) employ a database monitor such as Navicat Monitor. It has a query analyzer that monitors queries in real time to quickly improve the performance and efficiency of your server. It shows the summary information of all executing queries and lets you easily uncover problematic queries. As you can see in the image below, Navicat Monitor can sort queries by execution time, so that the slowest can be found at a glance:
Conclusion
In this blog we learned a few easy ways to identify slow queries using the MySQL PROCESSLIST Table as well as Navicat Monitor.
Click here for more details about all of Navicat Monitor's features, or, download the 14-day fully functional free trial!


