

As mentioned in the recent Present Your Data More Effectively with Navicat 16 blog, Navicat 16 added some new charting features, such as support for more data sources and chart types as well as an increased focus on usability and accessibility. These improvements coincide with the release of the new standalone Navicat Charts Creator. This blog will provide a tour of the Navicat Charts Creator and demonstrate how the Navicat Charts Creator can help you to gain deeper insights from your data.
About Workspaces
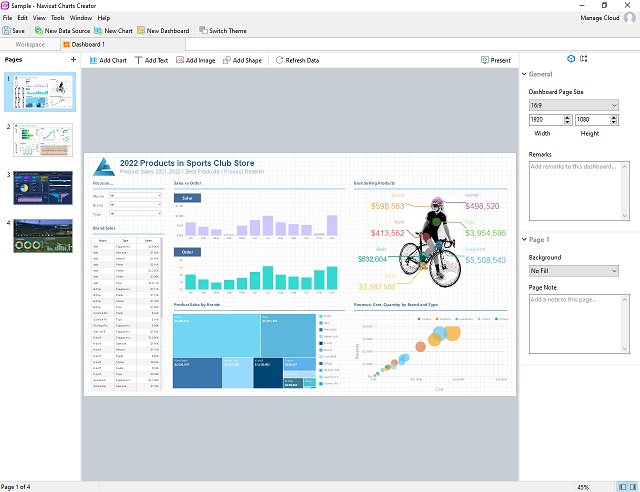
As the name suggests, a workspace is the place that gathers various resources together to work with as a cohesive unit. In the case of the Navicat Charts Creator, the workspace contains dashboards, charts and data sources. You can create multiple dashboards, charts and data sources within a single workspace. If you are new to the Navicat Charts Creator you can open the sample workspace and explore its contents:
Creating a Workspace
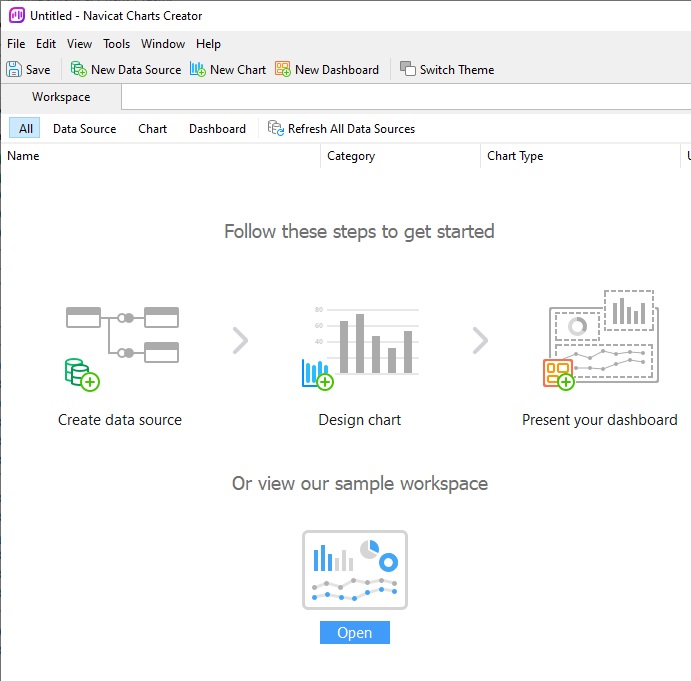
In the main window, click New Workspace. You're now ready to create data sources, charts and dashboards:
When it's time to save your workspace, you have the option of saving it locally or in the Cloud. To save locally, you would choose File -> Save from the main menu, while to save to the Cloud, you would select File -> Save to Cloud. From there, you only need to enter the workspace name and choose the project.
Data Sources
When building a chart, you will need to specify a data source that will supply the chart data via a dataset. The fields in the dataset can be used to construct a chart. Data sources can reference tables in your connections or data in files/ODBC sources, as well as select data from tables on different server types.
Creating a Data Source
To create a data source:
- In the Workspace window, click the New Data Source button, located directly under the main toolbar.
- Enter the name of the data source and select the desired connections, files or existing data sources. On the New Data Source dialog, you can choose from three options: Database, File/ODBC, or Connections in Existing Data Sources:

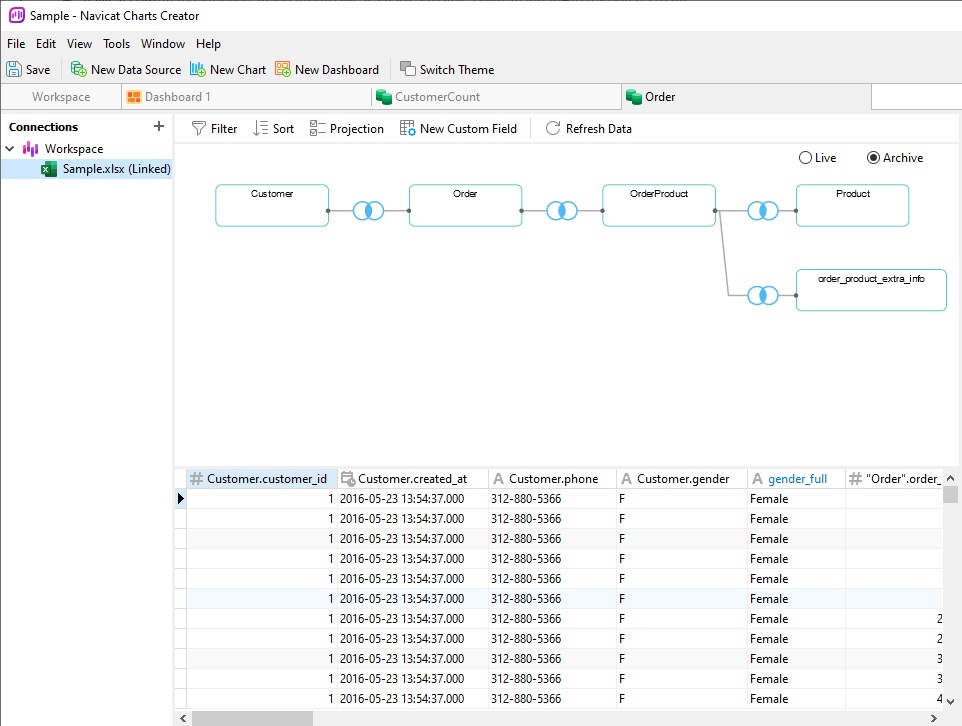
Upon clicking the OK button, a tab will open where you can edit the data source. Moreover, if you want to add more connections, you can click the plus (+) symbol at the top of the Connections pane and repeat the above steps.
To add tables to the Design pane, simply drag and drop them from the Connections pane! Likewise, nodes may also be connected to one another to create joins via drag and drop. Join types may be configured if necessary by clicking on them. To view the table data at any time, click the Preview button.
Charts
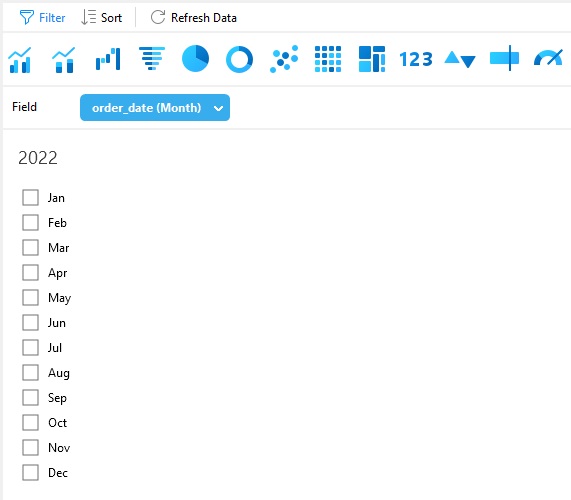
A chart is what provides a visual representation of the data in your data source. Mapping to a single data source, a chart can display correlations between several fields in the data. Navicat Charts Creator supports no less than 17 chart types! You can even make the chart interactive by adding a control chart. Here's one that allows the user to select order date months:
Conclusion
I hope that you enjoyed the tour of the Navicat Charts Creator. This blog really only scratched the surface of what it can do, but we'll be looking at the Navicat Charts Creator's capabilities in more detail over the next several weeks. In the meantime, you can download the Standalone Charts Creator and try it for free for 14 days!


