

Part of knowing your business is tracking sales metrics such as units sold and identifying your best customers. To that end, you'll probably want to begin with fetching data about customers who've made the most purchases throughout the month, quarter, year, or other time period. This data will allow you to analyze their buying patterns and identify trends. This blog will present a few sample queries to do that by combining the mighty Count() function with the GROUP BY and HAVING clauses.
A Basic Query
We'll be executing our queries against the Sakila Sample Database. It's a nicely normalized schema modeling a DVD rental store, featuring things like films, actors, film-actor relationships, and a central inventory table that connects films, stores, and rentals. Hence, its customers are not buying movies, but rather, renting them. Nevertheless, the criteria for selecting the data remains the same, which is to count the rows of the main rental table and group results by customer_id. Here is a basic query in Navicat Premium 16 that limits results to those customers who rented more than 20 movies in total:
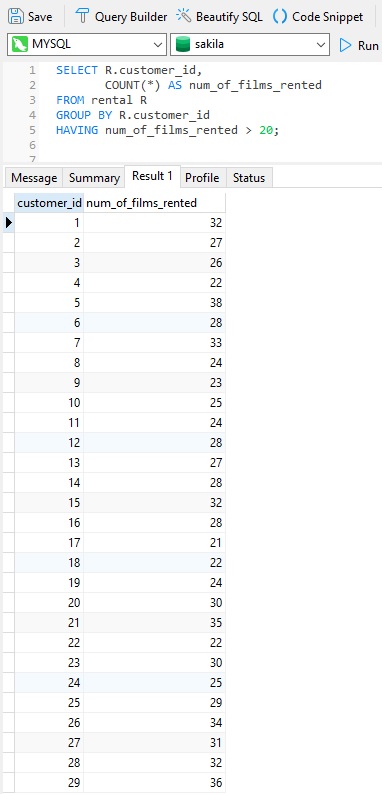
That orders results by customer_id. Later on, we'll sort results by num_of_films_rented.
Fetching Additional Customer Details
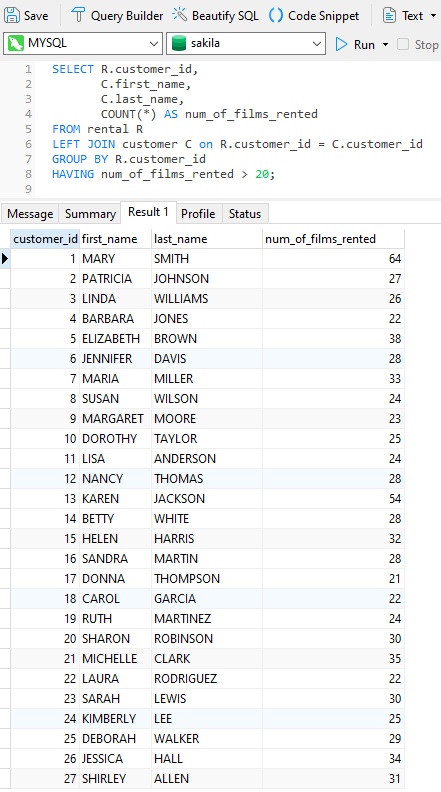
While the above query is sufficient to identify those customers who rented many movies, it does not provide any customer details other than their IDs. To include more customer data, we need to join the customer table. It should be LEFT JOINed so that only customers who have rented movies are joined to the main query. Here are the results with customer names added:
Filtering Results
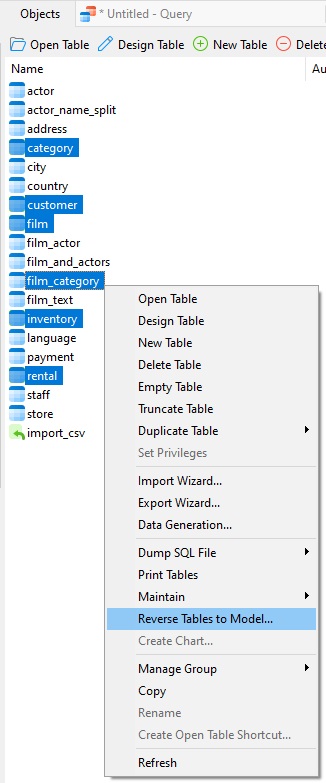
So far, we've been casting a very wide net, including results for all films and time periods. We could get more specific by targeting films by category as well as time period. To do that, we'll need to add a few more tables. If you're ever unsure on how to JOIN tables to a query, in Navicat, you can select the tables in the Object pane and run the Reverse Tables to Model... command:
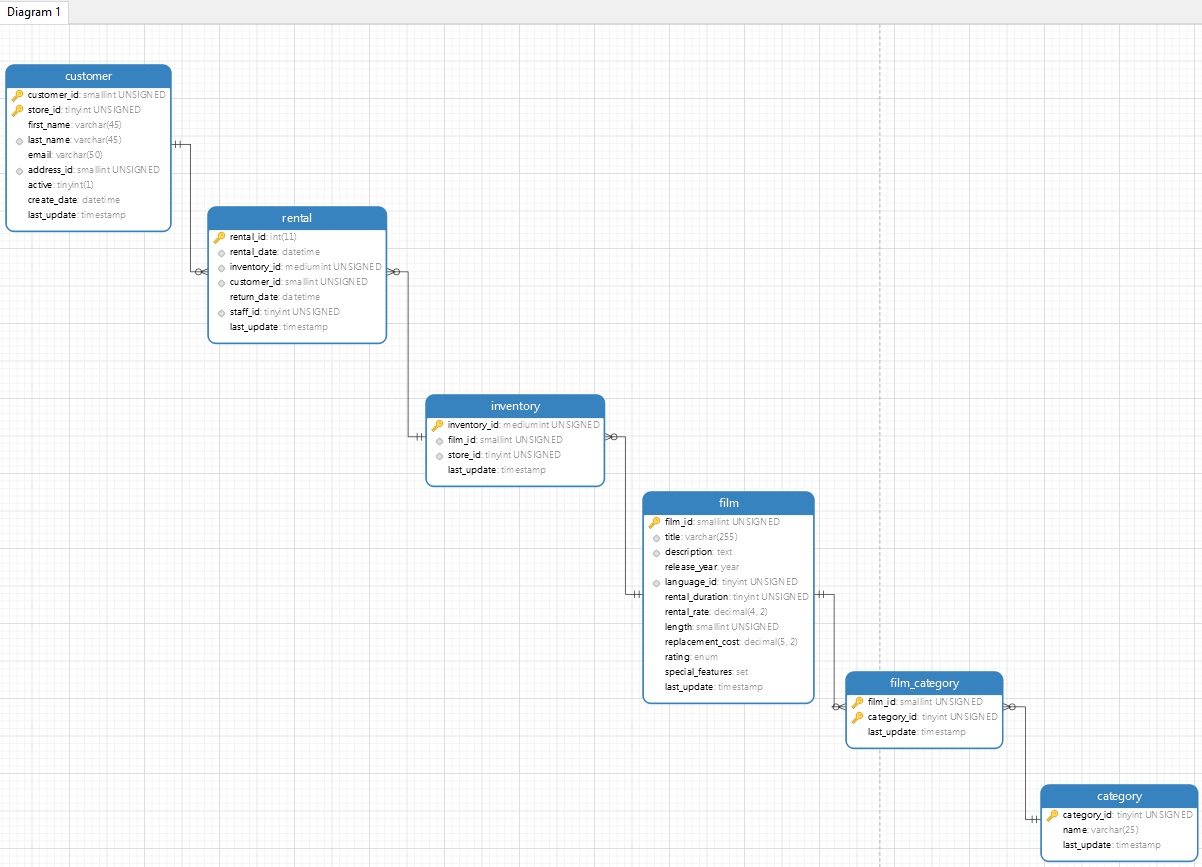
That will add them to a schema diagram in the Modeling Tool so that you can view their relationships:
In the revised query, we'll limit results to comedies that were rented throughout 2005:
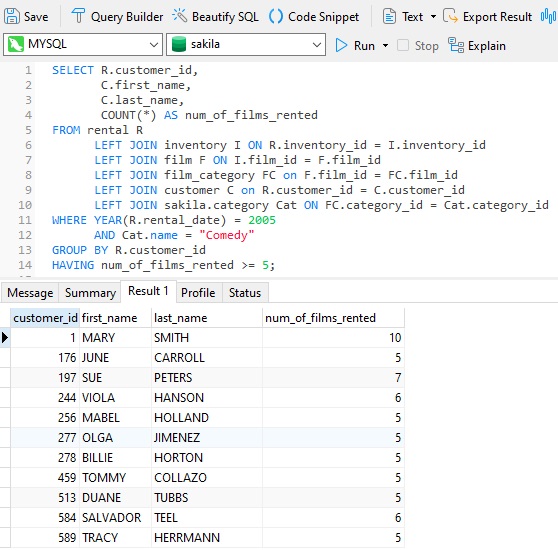
Notice that the minimum film count was lowered to 5 or more because there are less rentals for a single category.
Sorting By Count
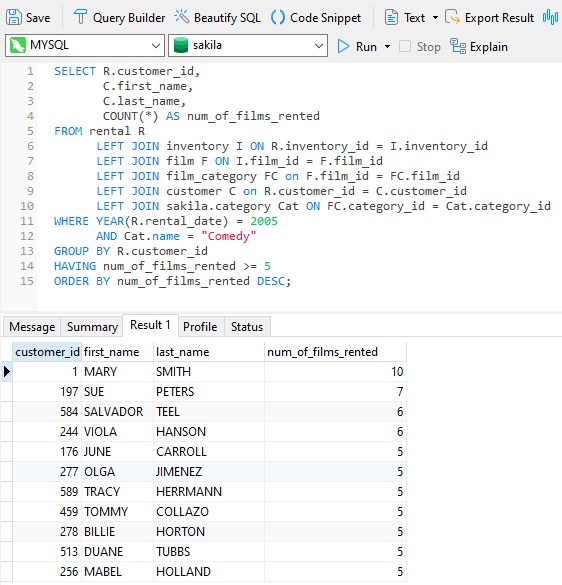
Perhaps you'd rather view records by rental counts. All that's required to make that happen is to include an ORDER BY clause. Here is the final query, sorted by num_of_films_rented in DESCending order, so that the customer who rented the most comedies in 2005 appears at the top of the results:
Conclusion
In today's blog we learned how to combine the Count() function with the GROUP BY and HAVING clauses to gain valuable insight into our customers' spending habits. As you can imagine, the same query structure can be utilized to discover all sorts of trends and patterns related to product sales and/or rentals. Insights gleaned can be of tremendous benefit in guiding organizational decisions.


