

Navicat Monitor 3 added support for PostgreSQL, one of the most popular modern relational databases in use today. New features include an SQL Profiler for PostgreSQL instances as well as enhanced Query Analyzer and Long Running Queries pages, both of which were touched upon in the Monitoring PostgreSQL with Navicat Monitor 3.0 blog article. Today's topic will be the Instance Details page.
Instance Details Page at a Glance
The Instance Details page is accessible by clicking on an instance card in the Overview page. It shows server parameters and metrics in a visual way, providing you with a quick view of the server load and performance. There, you can view:
- the top 5 databases based on size
- the top 5 tables based on size
- system charts on CPU, Memory, Swap, and DB Disk Usage
- metrics on connections, queries, tables, buffer, cache and sort, as well as locks
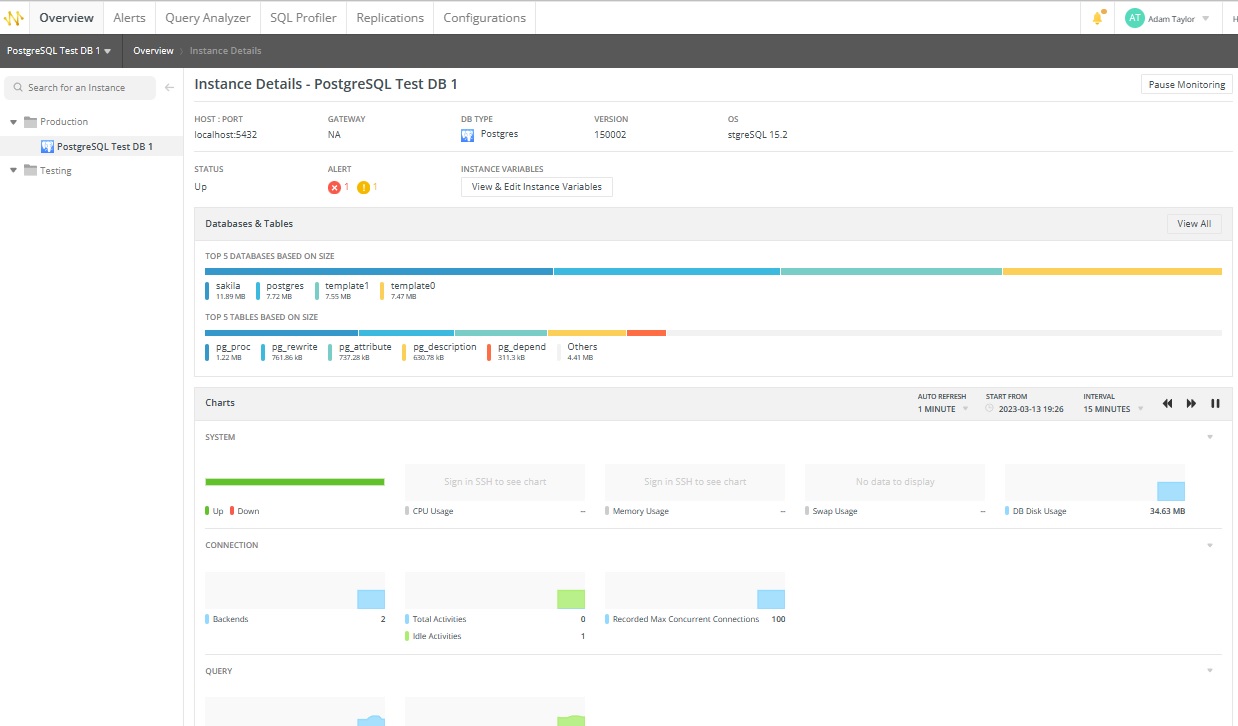
Information on the Instance Details Page
The Instance Details page is split up into the following three sections:
- Summary
- Databases & Tables
- Charts
Here's a breakdown of each section:
Summary
The summary displays host information about the server, server properties, alerts and status. There, you can view or edit the instance variables as well as click on raised alerts to open the alert page.
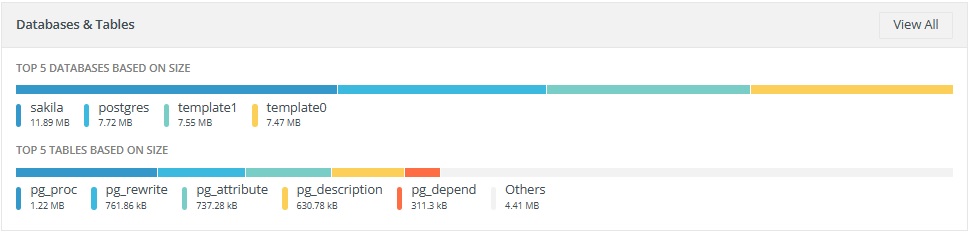
Databases & Tables
This section displays the top five databases and tables by size, as well as a sixth category called "Others" that groups the remaining databases or tables. You can hover over each segment to show the size percentage. To view size information of all databases and tables in the instance, click the View All button.
Charts
Navicat Monitor displays visualizations of server performance metrics as small charts. The charts track and refresh the data at certain intervals, which are configurable by the user. Related metrics are displayed using different predefined colors and symbols. Note that, due to size constraints, the axis scales and labels of the small charts are not printed.
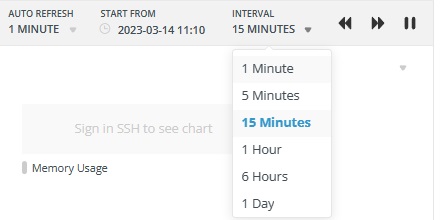
Both the time interval (X-axis) and refresh options are configurable via the AUTO REFRESH drop-down menu, the START FROM datetime picker, the time INTERVAL drop-down menu and the panning arrows:
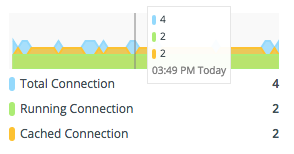
Hovering the mouse pointer over a chart will display the values at that point:
You can also click on a chart to open the Chart page in order to view the details of an individual chart or to see more charts.
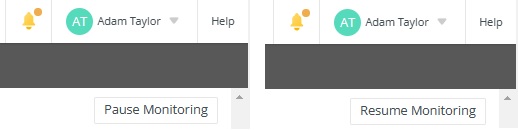
Pausing (and Resuming) Monitoring
You can pause and resume monitoring the instance here by using the Pause Monitoring and Resume Monitoring buttons, located in upper-right quadrant of the Instance Details page:
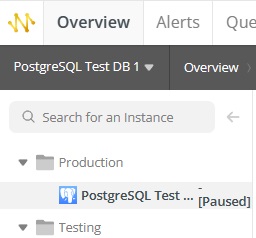
Navicat Monitor stops collecting information from the server until the monitoring resumes and adds the "[Paused]" indicator beside the names of paused instances in the Instances Pane (on the left):
Final Thoughts on Viewing PostgreSQL Instance Details in Navicat Monitor 3
Today's covered Navicat Monitor 3's Instance Details screen. It shows the server parameters and metrics in a highly visual way, gives you a quick view of the server load and performance, and more!


